By Doug Ward

A colleague’s daughter recently finished her first year of college. In high school, he said, she had never really had to study to get good grades. In college, though, she had to adjust her study habits and her thinking after her early grades dipped below the A’s and B’s she had routinely – and easily – received.

That sort of dip in grades is common among traditional freshmen as they learn to live away from home for the first time, deal with the liberation and temptations of personal independence, and try to make sense of the academic expectations of college. How they deal with that jolt can affect everything from their choice of majors to their ability to stay in college.

Jennifer Meta Robinson, an anthropology professor at Indiana University-Bloomington, has been studying this phenomenon, which she calls “grade surprise.” Students usually have a good sense of the grades they will receive on assignments or exams, or in a class. When that expectation doesn’t match reality, though, they experience grade surprise.

woman gestures as she stands amid seated in a conference room
Jennifer Meta Robinson explains her work in “grade surprise” to members of the steering committee of the Bay View Alliance.

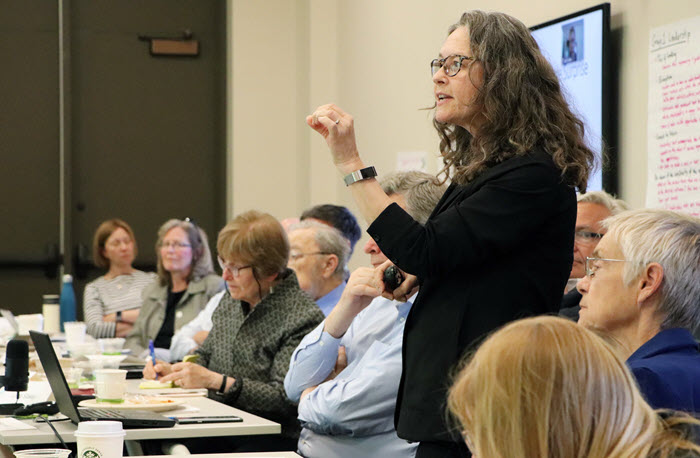
Robinson explained her research to the steering committee of the Bay View Alliance earlier this month in Bloomington, Indiana. Both Indiana and KU are members of the Bay View Alliance, a consortium of 10 research-intensive universities that are working to elevate teaching and improve learning among students. Robinson and colleagues in chemistry, computer science and informatics recently received a mini-grant from the Association of American Universities to continue their work of surveying students and analyzing university data to try to find questions they have about grade surprise among students:

  • How does grade surprise affect retention in various majors?
  • Does the power of grade surprise grow as students move through additional classes?
  • What approaches help students recover when they encounter grade surprise?

Robinson’s hypothesis is that grade surprise impedes student progress but can be mitigated. When students are overconfident, she said, failure is more painful than when they have low expectations about their grades.

“Surprise creates pain,” Robinson said.

She is also looking at the flip side of that: whether there is positive grade surprise.

“There’s a human tendency to rewrite the past,” she said. “We mitigate our pain by retelling our story in a way that makes it less surprising.”

For instance, students might tell themselves that a low grade was the instructor’s fault or that people like them just don’t do well with this type of material or in these types of classes. That type of thinking can easily push students out of classes or majors.

Interestingly, few students seem to blame instructors when grades come in lower than expected.

“We were surprised at how few students said, ‘The teacher had it in for me,’” Robinson said. “Or, ‘This was out of left field. I studied this other thing and it wasn’t on the test.’ There was very little of that. It really was about more about what I can do, what I practice, where I can spend more time. The locus of control was within.”

Disparities in distribution and reaction

Grade surprise isn’t equally distributed, Robinson said. Underrepresented minority students and first-generation students are more likely to be surprised by their grades. And women feel more disappointment when they receive lower grades.

Robinson and her colleagues have been sharing context about grades to try to ease some of the pain of grade surprise. For instance, in computer science and informatics classes at Indiana, women generally receive higher grades than men. In chemistry, women and men receive similar grades, although all receive lower grades than they did in high school.

“So women may feel that more, that disappointment in themselves, that setback of, ‘Oh, maybe I don’t belong,’” Robinson said. “But that’s where we could say to them that they may be processing this differently but the GPA facts of it are that they are doing the same.”

An analysis of data at Indiana shows that many students bounce back after the shock of an initial grade. They expect an A, receive a C but then eventually get an A in the course. Robinson and her colleagues want to better understand what students do to recover. They are also looking at the mindset of students who think they did poorly on, say, a midterm exam but actually did well. What happens if they enroll for the subsequent semester before they know their grade?

“What is that little detour through the course?” she asked. “How long does that hang in the air that you think you’ve bombed but you get that assignment back and got that A after all?”

A move toward wider use of data

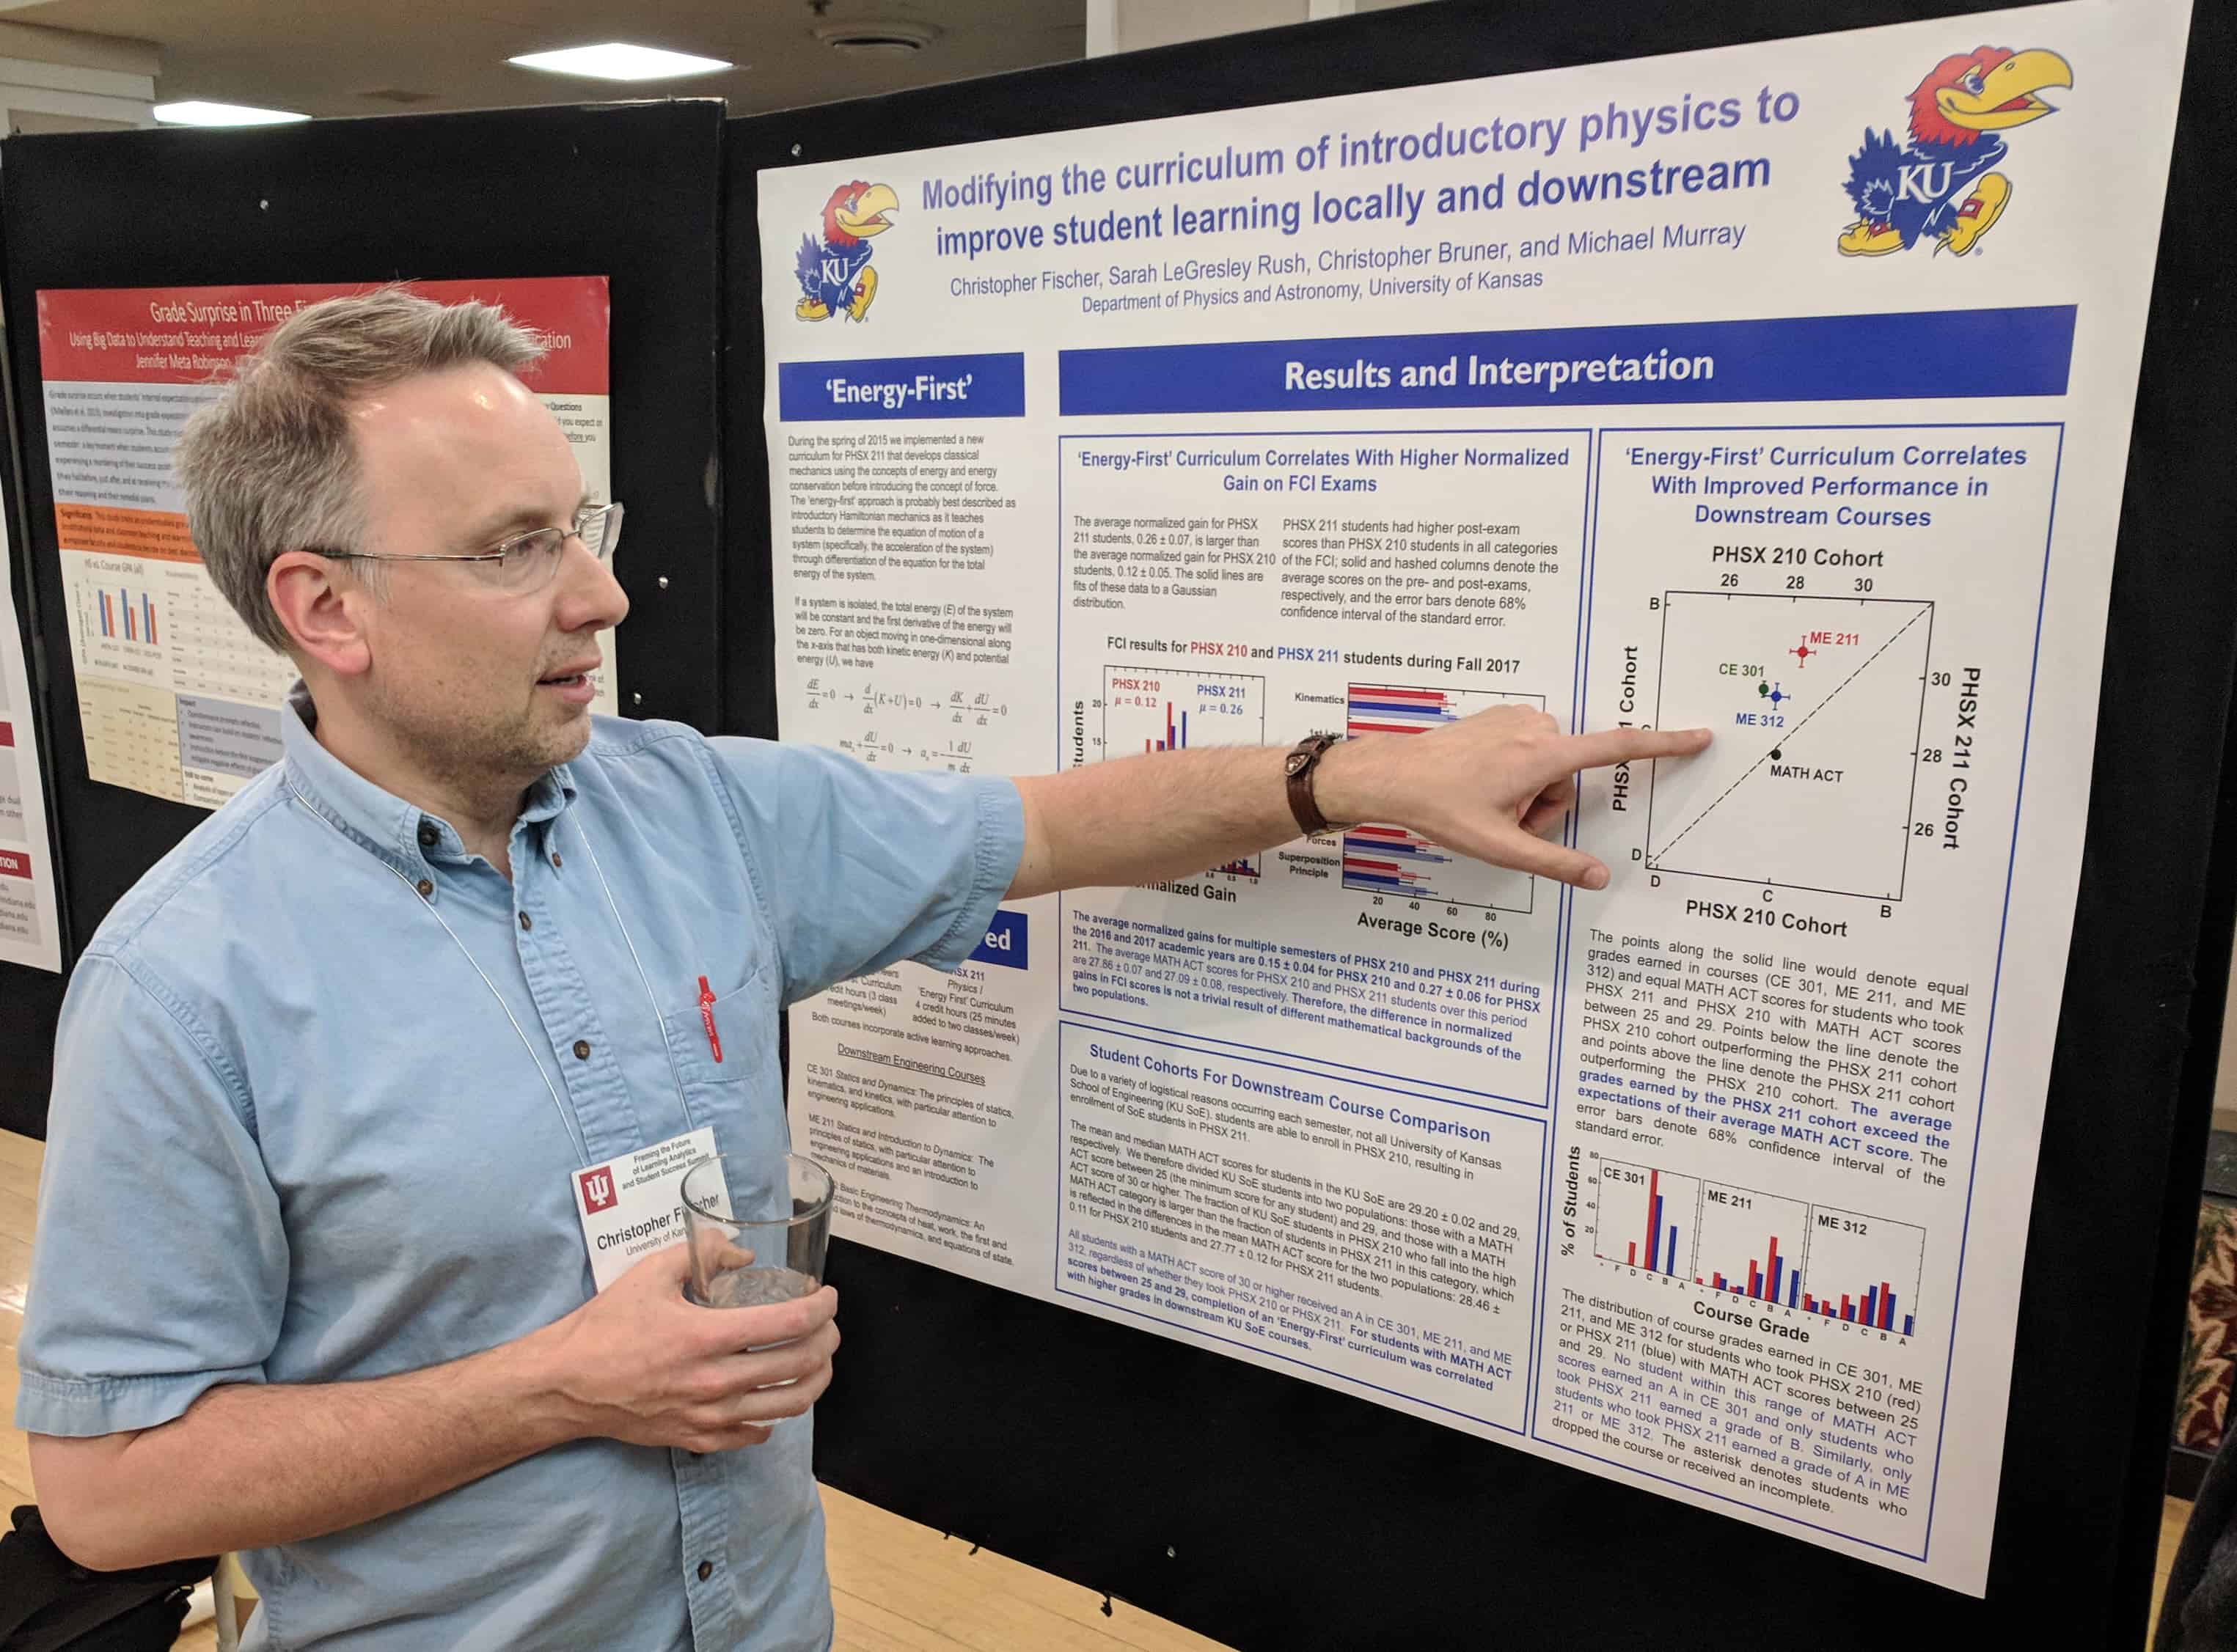
Robinson describes the grade surprise project as one of many that “connect classes to the potential of big data.” Indiana has an ambitious program in helping faculty members combine university demographic data with data about student performance in classes. That combination is often referred to as learning analytics. The Indiana program, known as Learning Analytics Fellows, has led to more than 50 projects since it started in 2015. It is run through a recently created Center for Learning Analytics and Student Success.

We have been working on a similar project at KU, though at a smaller scale. An AAU mini-grant through the Center for Teaching Excellence has allowed several STEM departments to use university data to learn more about their students and about the paths they take through various curricula. The recently created Office of Analytics and Institutional Research (formerly the Office of Institutional Research and Planning) has continued the momentum around wider application of university data. One of its divisions focuses on academic data analytics and is looking at ways of making more data available to faculty members.

These types of data project allow instructors and departments to ask new questions about curricula, with an eye toward improving student retention and graduation rates. As Robinson explained in her talk at Indiana, this use of data is driving culture change as universities find ways to scale learning analytics even as they explore the potential of data in education. Robinson emphasized the importance of providing context for data and of applying “interpretive muscle” to tease out insights.

“These are drivers for change at all of our universities,” she said.


Doug Ward is the associate director of the Center for Teaching Excellence and an associate professor of journalism. You can follow him on Twitter @kuediting.

By Doug Ward

Data analytics holds great potential for helping us understand curricula.

By combining data from our courses (rubrics, grades, in-class surveys) with broader university data (student demographics, data from other courses), we can get a more meaningful picture of who our students are and how they perform as they move through our curricula.

Sarah LeGresley Rush and Chris Fischer in the KU physics department offered a glimpse into what we might learn with a broader pool of university data at a departmental colloquim on Monday. LeGresley Rush and Fischer explained analyses suggesting that a shift in the way an early physics class is structured had led to improvements in student performance in later engineering classes.

Chris Fischer works with students in General Physics II.

That reference to engineering is correct. Engineering students take introductory physics before many of their engineering classes, and the physics department created a separate class specifically for engineering majors.

A few years ago, Fischer began rethinking the structure of introductory physics because students often struggled with vector mathematics early in the course. In Spring 2015, he introduced what he called an “energy first” approach in Physics 211, focusing on the principle of energy conservation and the use of more applied calculus. The other introductory class, Physics 210, maintained its traditional “force first” curriculum, which explores classical mechanics through the laws of motion and uses little applied calculus. Both classes continued their extensive use of trigonometry and vectors, but Physics 211 adopted considerable material on differentiation and integration, which Physics 210 did not have.

LeGresley Rush, a teaching specialist in physics, joined Fischer, an associate professor, in evaluating the changes in two ways. First, they used results from the Force Concept Inventory, an exam that has been used for three decades to measure students’ understanding of concepts in introductory physics. They also used university analytics to see how students in the two introductory sections fared in a later physics course and in three engineering courses.

In both analyses, students who completed the revised physics courses outperformed students who took the course in the original format. The biggest improvements were among students with ACT math scores below 22. In every grouping of ACT scores they used (22-24, 25-27, 28-30, and above 30), students who took the revised course outperformed those who took the course in the traditional format. Those on the lower end gained the most, though.

Sarah LeGresley Rush

They next looked at how students in the two sections of introductory physics did in the next course in the department sequence, General Physics II. The results were similar, but LeGresley Rush and Fischer were able to compare student grades. In this case, students who completed the transformed course earned grades nearly a point higher in General Physics II than those who took the traditional course.

Finally, LeGresley Rush and Fischer used university data to track student performance in three engineering courses that list introductory physics as a requirement: Mechanical Engineering 211 (Statics and Introduction to Mechanics) and 312 (Basic Engineering Thermodynamics), and Civil Engineering 301 (Statics and Dynamics). Again, students who took the revised course did better in engineering courses, this time by about half a grade point.

“Why?” Fischer said in an earlier interview. “We argue that it’s probably because we changed this curriculum around and by doing so we incorporated more applied mathematics.”

He pointed specifically to moving vector mathematics to later in the semester. Vector math tends to be one of the most difficult subjects for students in the class. By helping students deepen their understanding of easier physics principles first, Fischer said, they are able to draw on those principles later when they work on vectors. There were also some changes in instruction that could have made a difference, he said, but all three physics classes in the study had shifted to an active learning format.

Fischer went to great lengths during the colloquium to point out potential flaws in the data and in the conclusions, especially as skeptical colleagues peppered him with questions. As with any such study, there is the possibility for error.

Nonetheless, Fischer and LeGresley Rush made a compelling case that a revised approach to introductory physics improved student learning in later courses. Perhaps as important, they demonstrated the value of university data in exploring teaching and curricula. Their project will help others at KU tackle similar questions.

The physics project is part of a CTE-led program to use university data to improve teaching, student learning, and retention in science, technology, engineering and math courses. The CTE program, which involves seven departments, is funded by a grant from the Association of American Universities. The Office of Institutional Research and Planning has provided data analysis for the teams.

A helpful tool for finding articles blocked by paywalls

A Chrome browser plug-in called Unpaywall may save a bit of time by pointing you to open access versions of online journal articles ensconced behind paywalls.

The plug-in, which is free, works like this:

When you find a journal article on a subscription-only site, Unpaywall automatically searches for an open version of the article. Often these are versions that authors have posted or that universities have made available through sites like KU Scholar Works. If Unpaywall finds an open copy of the article, it displays a green circle with an open lock on the right side of the screen. You click on the circle and are redirected to the open article.

It’s pretty slick. Unpaywall says its database has 20 million open access articles. It was integrated into Web of Science last year and is now part of many library systems.

Scott Hanrath, associate dean of libraries, said KU Libraries integrated a version of UnPaywall into its system in late 2016. If the “Get at KU” database doesn’t find a match for a source that libraries has access to, it tries the UnPaywall database as an alternative and provides a link if an open version of the article is available.

The Get at KU function is especially helpful in online searches, and the additional database opened even more options for finding articles quickly. I added UnPaywall to my search toolkit, as well. It seems like a useful addition, especially when I’m off campus.

You can read more about Unpaywall in a recent issue of Nature.


Doug Ward is the associate director of the Center for Teaching Excellence and an associate professor of journalism. You can follow him on Twitter @kuediting.

By Doug Ward

BLOOMINGTON, Indiana – We have largely been teaching in the dark.

By that, I mean that we know little about our students. Not really. Yes, we observe things about them and use class surveys to gather details about where they come from and why they take our classes. We get a sense of personality and interests. We may even glean a bit about their backgrounds.

That information, while helpful, lacks many crucial details that could help us shape our teaching and alert us to potential challenges as we move through the semester. It’s a clear case of not knowing what we don’t know.

Participants at a Learning Analytics Summit workshop grapple with definitions of student success and with how they might use data to better understand teaching and learning.

That became clear to me last week at the first Learning Analytics Summit at Indiana University. The summit drew more than 60 people from universities around the country to talk about how to make more effective use of academic data. I led workshops on getting started with data projects for analyzing courses, curricula, student learning and student success. As I listened and spoke with colleagues, though, I was struck by how little we know about our courses, curricula and students, and how much we stand to gain as we learn more.

Let me provide examples from the University of California-Davis and the University of New Mexico, two schools that have been piloting electronic systems that give instructors vast amounts of information about students before classes start.

Marco Molinaro, assistant vice provost for educational effectiveness at UC-Davis, showed examples of a new system that provides instructors with graphics-rich digital pages with such details as the male-female balance of a class, the number of first-generation students, the number of low-income students, the number of underrepresented minorities, the number of students for whom English is a second language, the number of students who are repeating a class, the most prevalent majors among students in a class, previous classes students have taken, other courses they are taking in the current semester, how many are using tutoring services, comparisons to previous classes the instructor has taught, and comparisons to other sections of the same class.

For privacy reasons, none of that data has names associated with it. It doesn’t need to. The goal isn’t to single out students; it’s to put information into the hands of faculty members so they can shape their classes and assignments to the needs of students.

That data can provide many insights, but Molinaro and his staff have gone further. In addition to tables and charts, they add links to materials about how to help different types of students succeed. An instructor who has a large number of first-generation students, for instance, receives links to summaries of research about first-generation students, advice on teaching strategies that help those students learn, and an annotated bibliography that allows the instructor to go deeper into the literature.

Additionally, Molinaro and his colleagues have begun creating communities of instructors with expertise in such areas as working with first-generation students, international students, and low-income students. They have also raised awareness about tutoring centers and similar resources that students might be using or might benefit from.

Molinaro’s project is funded by a $1 million grant from the Howard Hughes Medical Institute. It began last fall with about 20 faculty members piloting the system. By the coming fall, Molinaro hopes to open the system to 200 to 300 more instructors. Eventually, it will be made available to the entire faculty.

Embracing a ‘cycle of progress’

Providing the data is just the first step in a process that Molinaro calls a “cycle of progress.” It starts with awareness, which provides the raw material for better understanding. After instructors and administrators gain that understanding, they can take action. The final step is reflection, which allows all those involved an opportunity to evaluate how things work – or don’t work – and make necessary changes. Then the cycle starts over.

“This has to go on continuously at our campuses,” Molinaro said.

As Molinaro and other speakers said, though, the process has to proceed thoughtfully.

For instance, Greg Heileman, associate provost for student and academic life at the University of Kentucky, warned attendees about the tendency to chase after every new analytics tool, especially as vendors make exaggerated claims about what their tools can do. Heileman offered this satiric example:

First, a story appears in The Chronicle of Higher Education.

“Big State University Improves Graduation Rates by Training Advisors as Mimes!”

The next day, Heileman receives email from an administrator. The mime article is attached and the administrator asks what Heileman’s office is doing about training advisors to be mimes. The next day, he receives more email from other administrators asking why no one at their university had thought of this and how soon he can get a similar program up and running.

The example demonstrates the pressure that universities feel to replicate the success of peer institutions, Heileman said, especially as they are being asked to increase access and equity, improve graduation rates, and reduce costs. On top of that, most university presidents, chancellors and provosts have relatively short tenures, so they pressure their colleagues to show quick results. Vendors have latched onto that, creating what Heileman called an “analytics stampede.”

Chris Fischer, associate professor of physics and astronomy at KU, speaks during a poster session at the analytics conference in Bloomington, Indiana.

The biggest problem with that approach, Heileman said, is that local conditions shape student success. What works well at one university may not work well at another.

That’s where analytics can play an important role. As the vice provost for teaching and learning at the University of New Mexico until last fall, Heileman oversaw several projects that relied on university analytics. One, in which the university looked at curricula as data for analysis, led to development of an app that allows students to explore majors and to see the types of subjects they would study and classes they would take en route to a degree. That project also led to development of a website for analysis and mapping of department curricula.

One metric that emerged from that project is a “blocking factor,” which Heileman described as a ranking system that shows the likelihood that a course will block students’ progression to graduation. For instance, a course like calculus has a high blocking factor because students must pass it before they can proceed to engineering, physics and other majors.

Better understanding what classes slow students’ movement through a curriculum allows faculty and administrators to look more closely at individual courses and find ways of reducing barriers. At New Mexico, he said, troubles in calculus were keeping engineering students from enrolling in several other classes. The order of classes also created complexity that made graduation more difficult. By shifting some courses, students began taking calculus later in the curriculum. That made it more relevant – and thus more likely that students would pass – and helped clear a bottleneck in the curriculum.

Used thoughtfully, Heileman said, data tells a story and allows us to formulate effective strategies.

Focusing on retention and graduation

Dennis Groth, vice provost for undergraduate education at Indiana, emphasized the importance of university analytics in improving retention and graduation rates.

Data, he said, can point to “signs of worry” about students and prompt instructors, staff members and administrators to take action. For instance, Indiana has learned that failure to register for spring classes by Thanksgiving often means that students won’t be returning to the university. Knowing that allows staff members to reach out to students sooner and eliminate barriers that might keep them from graduating.

Data can also help administrators better understand student behavior and student pathways to degrees. Many students come to the university with a major in mind, Groth said, but after taking their first class in that major, they “scatter to the wind.” Many find they simply don’t like the subject matter and can’t see themselves sticking with it for life. Many others, though, find that introductory classes are poorly taught. As a result, they search elsewhere for a major.

“If departments handled their pre-majors like majors,” Groth said, “they’d have a lot more majors.”

Once students give up on what Groth called “aspirational majors,” they move on to “discovery majors,” or areas they learn about through word of mouth, through advisors, or through taking a class they like. At Indiana, the top discovery majors are public management, informatics and psychology.

“Any student could be your major,” Groth said. That doesn’t mean departments should be totally customer-oriented, he said, “but students are carried along by excitement.”

“If your first class is a weed-out class, that chases people away,” Groth said.

Indiana has also made a considerable amount of data available to students. Course evaluations are all easily accessible to students. So are grade distributions for individual classes and instructors. That data empowers students to make better decisions about the majors they choose and the courses they take, he said. Contrary to widespread belief, he said, a majority of students recommend nearly every class. Students are more enthusiastic about some courses, he said, but they generally provide responsible evaluations.

In terms of curriculum, Groth said universities needed to take a close look at whether some high-impact practices were really having a substantial impact. At Indiana, he said, the data are showing that learning communities haven’t led to substantial improvements in retention or in student learning. They aren’t having any negative effects, he said, but they aren’t showing the types of results that deserve major financial support from the university.

As more people delve into university data, even the terms used are being re-evaluated.

George Rehrey, director of Indiana’s recently created Center for Learning Analytics and Student Success, urged participants to rethink the use of the buzzword “data-driven.” That term suggests that we follow data blindly, he said. We don’t, or at least we shouldn’t. Instead, Rehrey suggested the term “data-informed,” which he said better reflected a goal of using data to solve problems and generate ideas, not send people off mindlessly.

Lauren Robel, the provost at Indiana, opened the conference with a bullish assessment of university analytics. Analytics, she said, has “changed the conversation about student learning and student success.”

“We can use this to change human lives,” Robel said. “We can literally change the world.”

I’m not ready to go that far. University analytics offer great potential. But for now, I’m simply looking for them to shed some light on teaching and learning.

Data efforts at KU

KU has several data-related projects in progress. STEM Analytics Teams, a CTE project backed by a grant from the Association of American Universities, have been drawing on university data to better understand students, programs and progression through curricula. The university’s Visual Analytics system makes a considerable amount of data available through a web portal. And the recently created Business Intelligence Center is working to develop a data warehouse, which will initially focus on financial information but will eventually expand to such areas as curriculum, student success and other aspects of academic life. In addition, Josh Potter, the documenting learning specialist at CTE, has been working with departments to analyze curricula and map student pathways to graduation.


Doug Ward is the associate director of the Center for Teaching Excellence and an associate professor of journalism. You can follow him on Twitter @kuediting.

CTE’s Twitter feed