By Doug Ward

KU’s big jump in freshman enrollment this academic year ran counter to broader trends in higher education.

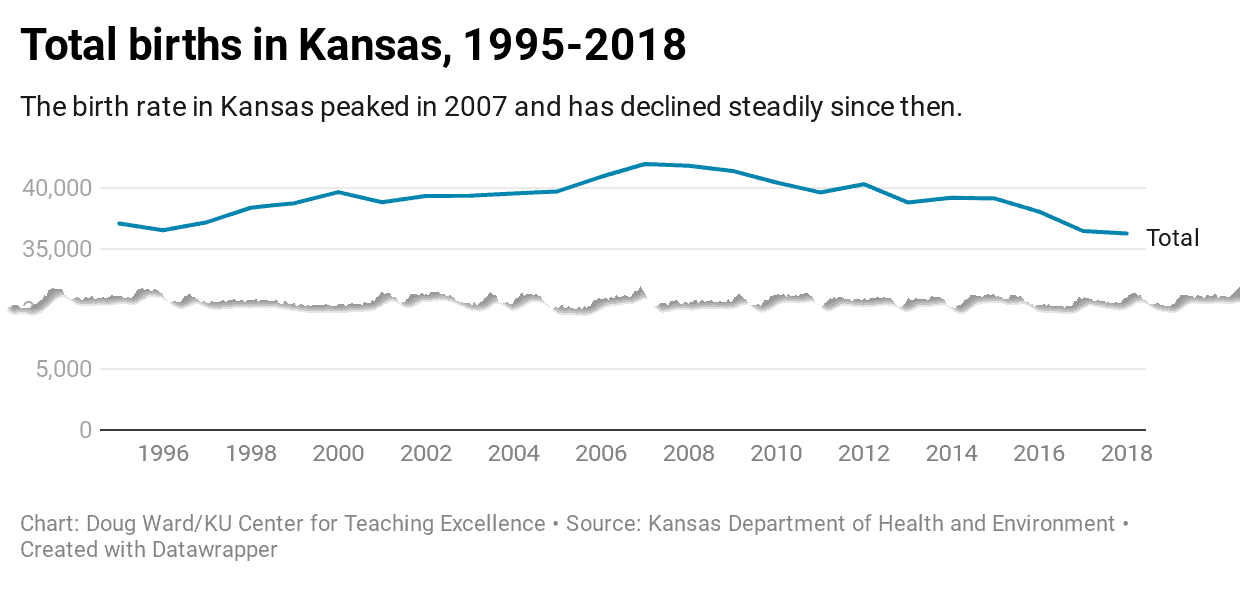
Around the country, college enrollment has been trending downward (although there was a slight increase in 2023), many campuses have been closing or consolidating, and a lower birthrate after the 2008-09 recession looms in what has become known as the “enrollment cliff.” That is, with fewer births, there will soon be fewer students graduating from high school and thus fewer potential college applicants.

Even so, KU was one of only 10 flagship universities where overall enrollment declined in the 2010s, according to a Chronicle of Higher Education analysis. In the fall, though, freshman enrollment increased 18%, to 5,259, the largest freshman class ever. If current trends continue, there may be another growth spurt next year. But why?

Flagships as backups

The university has credited the increase to reputation, recruitment strategies, increases in financial aid, and an improved football team. I have no doubt that recruitment strategies and financial aid played a significant role, and reputation always matters. I look for broader (often cultural) trends, though. Jeff Selingo, who writes about admissions, innovation, and the future of higher education, offers some possible explanations in his latest email newsletter. Selingo argues that many students, especially those in the top 5% to 10% of incomes, are going to state flagship universities if they don't get into top-ranked schools. He writes:

What I’m finding in my book research is that some families are increasingly skipping over this next ring of institutions from the very top because they don’t get good offers of merit aid. So, instead, the families chase dollars from a set of institutions deeper in the rankings or the kid heads off to an honors college at a flagship public with a low net price (sometimes zero) and lots of perks, like early access to course registration and sponsored research projects with faculty.

This idea of let’s try for Ivy U., and then if not, State U. has been common in some places like Georgia and Florida for decades ...

He highlights another trend that is certainly affecting KU: out-of-state enrollment growing faster than in-state enrollment.

“Nearly every public flagship enrolled a smaller share of freshmen from within their states in 2022 than they did two decades earlier,” Selingo said, citing a Chronicle analysis of data from the Department of Education.

At KU, the percentage of freshmen from Kansas fell to perhaps its lowest ever (56%) in Fall 2023, according to data from Analytics, Institutional Research, and Effectiveness. That is a decline of 13.1 percentage points from 2002, when in-state students made up 69.1% of the freshman class, according to the Chronicle analysis.

The number of Kansas students enrolled as freshmen at KU actually rose to at least a 10-year high, but the number of out-of-state students rose even more, with the university attracting more students from such states as Missouri, Nebraska, Illinois, Iowa, Colorado, Minnesota, and Oklahoma.

The declining percentage of in-state freshmen at KU is actually less substantial than that at some other state universities. Here are a few examples from nearby states, drawing on data from the Chronicle analysis.

% of in-state freshmen at state flagship universities

University 2002 2022 Change (in %pts.)
Colorado 54.9 53.6 -1.3
Iowa 59.5 53.8 -5.7
Nebraska 82.9 73 -9.9
KU 69.1 57.6 -11.5
Missouri 82.6 69.9 -12.7
South Dakota 67 52.8 -14.2
Illinois 89.2 71.4 -17.8
Indiana 65.1 52.3 -17.8
Ohio State 84.6 66.7 -17.9
Wisconsin 64.2 43.8 -20.4
Oklahoma 76.3 52.9 -23.4
Arkansas 80.5 39.3 -41.2

If the trends that Selingo indentified hold, KU could see continued growth among out-of-state students, especially those with family incomes of $160,000 and up. The trends also suggest that attracting those students will require higher levels of financial aid, admission to the honors program, and opportunities to work with individual faculty members. In other words, out-of-state students who are rejected by the Ivy League and similar highly ranked schools expect more perks from KU and other state flagship universities.

The sudden growth has brought in additional money to the university, but Jeff DeWitt, KU's chief financial officer, said in a presentation in November that the university had spent millions of additional dollars on scholarships, instructors, advisors, and housing.

"Record enrollment is not free," DeWitt said.

The trends that are benefiting KU and other state flagship universities have made recruitment more difficult at regional universities, the Chronicle reports. Among Kansas regents universities, for instance, only KU (4.1%) and Wichita State (5.1%) have increased enrollment over the past decade. Three others have had dramatic decreases: Pittsburg State (-25.7%), Emporia State (-25.1%), and K-State (-21.5%). Fort Hays State’s enrollment fell 5.7% during the same period. (I’ve excluded the medical center and K-State’s veterinary medicine program, both of which have increased in enrollment but are still relatively small.)

All of that portends a very different look to higher education in Kansas in the coming years.

Are student-athletes employees?

A case before the National Labor Relations Board could force colleges and universities to designate athletes as employees and to pay them as such, Politico reports.

Depending on your perspective, that could either give student-athletes what they are rightfully owed or lead to the collapse of college sports, Politico says.

One passage from the Politico article offered an interesting interpretation on how colleges and universities have looked at athletes:

Pro-labor advocates argue that schools’ “student-athlete” designation is a legal term of art originally designed to shield institutions from player workers’ compensation claims. It deprives competitors of fair compensation for their talents or influence over the system that governs much of their day-to-day college experience, they note.

The NCAA and colleges and universities say, however, that college sports would not survive in their current form if designations were changed. As a result, Politico said, they may seek intervention from Congress if the NLRB forces them to pay athletes.

A ruling is expected in the early spring.


Doug Ward is an associate director at the Center for Teaching Excellence and an associate professor of journalism and mass communications.

By Doug Ward

The latest enrollment report for universities in the Kansas regents system (down 1.5%) seems worth little more than a shrug. Longer term, though, the higher education trends in Kansas will require considerable attention – and action.

Enrollment at the six regents universities has fallen 13.5%, or 10,100 students, since peaking in 2011. That average masks even bigger declines at individual universities: Pittsburg State, down 28.4% since 2011; K-State, down, 21.9%; Emporia State, down 19.7%.

Those make KU’s decline of 11.4% during that period look small, especially with 2022 enrollment basically unchanged since last year and with an 8.2% increase in the number of freshmen this year. The percentage of out-of-state students increased, as well, and the university will no doubt continue to rely on out-of-state students, considering that the rate of Kansas high school students going to in-state public colleges has dropped 10 percentage points, to 44.8%, since 2015.

I’ve written quite a bit about the persistent enrollment challenges in Kansas and around the country. It’s a daunting topic that will require strategic thinking at every level of the university. (Recent cuts at Emporia State offer a glimpse at just how painful this could become.) The rethinking of how we approach higher education must include classes, an area where many instructors have made great improvements but where KU still has considerable work to do in adopting teaching practices that promote student success. It must also include the many structural barriers that Michael Dennin, vice provost for teaching and learning at the University of California, Irvine, spoke about at this year’s Teaching Summit. Those include things like curricula that are difficult for students to navigate and that make assumptions about student capabilities; demands on faculty time; inflexibility in classes and curricula; and a system that provides few incentives for cooperation.

It is through that lens of teaching that I look at some of the areas that stand out in this fall’s enrollment figures.

Women and men

At regents universities, women account for 56% of the overall student population, up about 3 percentage points over five years. Men now make up only 43.8% of the overall student population, down about 3 percentage points over that same period.

KU has a larger percentage of men (46.7%), but that may be the lowest percentage in the university’s history. I can’t say that with certainty, but it is the lowest since at least 1965, the first year for which Analytics, Institutional Research, and Effectiveness provides data.

In news reports from as far back as 1930, universities in Kansas and Missouri reported that their students were primarily men. In October 1960, for instance, The Kansas City Star reported that men outnumbered women 2 to 1 or 3 to 1 on most college campuses in Kansas and Missouri.

In terms of headcount, this year’s group of 11,146 men is the smallest since 1973, the last year the United States had a military draft. Overall headcount enrollment was 18,683 that year, 5,000 fewer than today’s, and men still accounted for 59.1% of students in 1973. Women at KU outnumbered men for the first time in 1988. Their numbers peaked in the early 2000s, but their percentage of total enrollment has grown each year since 2015. They now make up 53.2% of students at KU. That seems to be the highest ever.

The changes at KU have also followed national trends. Young women are more likely to graduate from high school on time and are substantially more likely to earn at least a bachelor’s degree (41% vs. 32% among those age 25 to 34), according to the Brookings Institution. Those numbers vary widely by state, though, as the Brookings table below shows.

Those same differences can be seen in graduate degrees. Since the early 2000s, women have earned about 60% of master’s degrees nationwide, and since 2005-06, more women than men have earned doctorates each year. The most recent totals from the National Center for Education Statistics show that women earn about 54% of Ph.D.s.

Graduation rates

KU rightfully boasted about all-time highs for four-, five-, and six-year graduation rates. The university’s year-over-year retention rate of 84.7% is virtually unchanged from a year ago. That’s also good news.

The not-so-good news is that 1 of every 5 students leaves the university after three semesters, and 1 of every 4 students leaves after two years.

And though the four-year graduation rate has increased nearly 20 points since 2007, it is still a paltry 55%. Over five years, 66.1% of students graduate. That’s a 10-point gain since 2007, but a third of students fail to earn a degree after five or six years. That six-year rate is lower than the average among full-time students at U.S. universities (67.4%) and among students at four-year public institutions (72%).

Graduate enrollment

The number of graduate students at KU has been declining steadily since 1991. At that peak, KU had 7,233 graduate students, according to statistics provided by AIRE. This fall, it has 5,166, a decline of 28.6% since 1991.

That is the smallest number of graduate students the university has had since 1974. This fall’s graduate cohort also makes up the smallest percentage of the overall student population (21.6%) since 1970 (20.2%). Declining numbers of undergraduates nationwide means that the pool of potential graduate students has also been shrinking.

KU’s declines in graduate enrollment run counter to nationwide trends over the last 10, 20 and 30 years, according to the National Center for Education Statistics. Since 1991, graduate enrollment has increased 21% at public universities and 58% at all U.S. universities.

Not surprisingly, the decline in graduate enrollment at KU has meant fewer graduate teaching assistants. The number of GTAs has fallen nearly 18% since 2014, from 1,127 to 927.

Online enrollment

The number of undergraduates taking online or hybrid online courses declined 14.7% this fall compared with Fall 2021. That is the second consecutive yearly decline since online and hybrid enrollment peaked during the pandemic-riddled Fall 2020 term.

Even so, online and hybrid online enrollment among undergraduates this fall was 22% higher than it was in Fall 2019, before the pandemic began. Those students are also taking more online credit hours (39% more than they did in Fall 2019). Those increases are no doubt even higher because of a change in the way KU accounted for online and online hybrid hours. I won’t go into those details, but a footnote on an AIRE-generated table explains the change.

Graduate enrollment in online courses shows a more troubling trend. If we omit the pandemic-inflated figures of 2020 and 2021, the number of students enrolled in graduate and professional courses online has increased 4.2% since Fall 2017, but the number of credit hours has declined nearly 15%.

In other words, there are slightly more online graduate students, but those students are taking fewer classes. The students looking for graduate programs online have also become more choosy, according to the educational consulting organization EAB. Those students often spend months or even years combing through university websites and looking for programs that provide the skills they want but that also waive admissions fees, overlook sometimes spotty undergraduate records, and allow admission without the GRE or other admissions tests.

Shaping the future

Those are just a few of the enrollment trends shaping KU and other universities, and the future will require both cultural and digital change, as John O’Brien argues in Educause.

Universities (KU included) are trying many new approaches as they adapt to shrinking numbers of students and changes among students. Those include more non-credit courses, certificate programs, stackable degrees, and micro-credentials. Some are creating partnerships with area businesses as students focus more urgently on skills they can use in jobs. Others are looking at ways to help students gain credentials in shorter time spans.

At CTE, our programs have helped departments define their curricula in terms of tangible skills, identify ways of making existing courses more appealing to students, create more cohesive curricula, clarify paths to degrees, and connect with more alumni. They have also helped faculty adapt their teaching to a more diverse student body, find ways of drawing on individual differences as a strength rather than a weakness, reinvigorate classes, and hone their teaching.

In all these programs, we have helped build a community that shares ideas and embraces innovation. That community will only grow more important as we navigate changes in enrollment, society, and expectations, and find a meaningful path to the future.


Doug Ward is associate director of the Center for Teaching Excellence and an associate professor of journalism and mass communications. You can follow him on Twitter @kuediting. You can also follow CTE @KU_CTE.

By Doug Ward

The headlines about KU’s fall enrollment sounded much like a Minnesotan’s assessment of winter: It could be worse.

Indeed it could have been, given the uncertainties brought on by the coronavirus and rumblings among students that they might sit out the year if their courses were online.

Depending on how you measure, enrollment on the Lawrence and Edwards campuses fell either 2.7% (headcount) or 3.4% (full-time equivalency) this fall. That is about the same as the nationwide average (-3%) but slightly worse than the average decline of 1.4% at four-year public universities, according to data from the National Student Clearinghouse Research Center.

A single year’s top-level data provides only a limited view of a much bigger picture. To better understand this year’s enrollment, we need to take a broader and deeper look in terms of geography, history and demographics. Here’s what I’m seeing in data from Academics and Analytical Research, the Kansas Board of Regents and some other sources.

Enrollment declines throughout the state

KU was hardly alone in dealing with the sting of an enrollment decline. Among regents universities, Pittsburg State had the largest decline in enrollment (-5.9%), followed by K-State (-5.1%), KU, Wichita State (-3.1%), Fort Hays State (-2.8%) and Emporia State (-2.3%).

As a whole, the state’s community colleges fared far worse, with a combined drop of 11.7%, about 2 percentage points higher than the national average. Johnson County Community College had the largest decline (18.7%). Enrollment at JCCC has fallen 23.5% over the past five years, a troubling statistic given KU’s proximity and institutional connections to JCCC. During that same period, enrollment at the state’s 19 community colleges has fallen by an average of 18.6%, according to regents statistics. Eight of those colleges recorded declines of more than 20%.

Kansas is one of 11 states where the decline in undergraduate enrollment exceeded the national average, according to the National Student Clearinghouse Research Center, Others include Missouri, Arkansas, Illinois, Indiana and Florida. Only five states recorded increases in undergraduate enrollment, including Nebraska.

Putting the trends into perspective

Over the past 50 years, college and university enrollment has reflected broader societal trends that made a college degree a sought-after goal. As numbers trend downward, though, enrollment figures also highlight the looming challenges that most of higher education faces.

From the 1960s to the 1980s, undergraduate enrollment rose steadily as baby boomers entered college in larger percentages than previous generations. The number of colleges – especially community colleges – grew, providing more opportunities for students to seek a degree. Federal aid, including low-interest loans, also expanded, as the federal government promoted the importance of education and invested in university research. A college degree became the minimum standard for many jobs and led to higher salaries over a degree holder’s lifetime.Chart showing total births in Kansas from 1995 to 2018

Those trends are certainly reflected in KU’s enrollment data. Between 1965 and 1991, headcount enrollment at KU nearly doubled. (See the chart below.) It declined after a recession in the early 1990s, but rose again in the early 2000s, peaking in 2008 during the recession. It declined until 2012, stabilized briefly, and then began another decline, one that is very likely to continue given a declining school population. K-12 enrollment in Kansas peaked in the 2014-15 school year, according to Kansas State Board of Education data. It is projected to start a significant decline in the late 2020s, largely because of a decline in birth rates after the recession of 2007-08. Since peaking in 2007, birth rates in Kansas have fallen 13.6%. (See the chart above with the most recent data available from the state.)

In another disturbing trend, the number of Kansas students coming to KU has dropped 17.7% since 2011. (It was down 2.9% this year.) The university has attracted more out-of-state students, who make up about 40% of the student population, but the trends among Kansas students are bleak.

KU attracts the largest number of students from Johnson County, which accounts for 28.3% of the university’s enrollment. The number of students from Johnson County has fallen 7.3% over the past decade. That is far less than the drop in students from other counties from which the university draws the most students: Douglas (-25.2% since 2011), Sedgwick (-27.1%), Shawnee (-26%). Declines in others aren’t as dramatic but are still troubling: Wyandotte (-9.8%), Leavenworth (-3.3%) and Miami (-3.2%). Others are far worse: Saline (-30.5%), Riley (45.1%), Reno (42.3%).


More Hispanic students, fewer international students

One of the most interesting developments I saw in enrollment this fall was that for the first time in decades, the number of Hispanic students at KU exceeded the number of international students. (See the chart below.)

This reflects two major trends. First the Hispanic population of Kansas has grown more than 70% since 2000. Hispanics now make up more than 12% of the Kansas population and 18.5% of the U.S. population. The number of Hispanic students at KU rose 3.3% this year and has risen nearly every year since the mid-1980s.

Meanwhile, the Trump administration has taken a less-than-welcoming stance toward international students and immigration in general. That, combined with a global pandemic and lack of a coherent plan for combatting the pandemic, has sent international enrollment at U.S. universities plummeting. By one estimate, the number of new international students at U.S. universities could soon reach the lowest level since World War II.

As KU reported, the number of international students at the university declined more than 18% this fall. That decline is greater than the 12.5% decline in international students at public four-year universities, according to data from the National Student Clearinghouse.

Other trends worth noting

  • A continuing rise in female students. The number of female students on the Lawrence campus continued to exceed the number of male students. The number of male students fell 1.4% this year, compared with 0.5% for female students, and has fallen 11% since 2011. For the first time in at least a decade, the number of women who transferred to KU was larger than the number of men who transferred. Men now make up 47.5% of the KU student population. Nationally, the number of women seeking college degrees surpassed the number of men seeking degrees in 1979. That was the first time since World War II that more women than men attended college, according to the National Center for Education Statistics. In the 40 years since then, the gap has only increased, as it did again this year. Sixty-seven KU students did not identify as male or female this year. That was similar to the 73 in 2018 but down from 509 in 2019, suggesting that last year’s spike was intended as statement against the reporting system, primarily by graduate students.
  • Another decline in graduate enrollment. The number of graduate students on the Lawrence campus fell 2.2% this year, compared with an increase of 4.7% at public four-year universities. That is the fourth consecutive year of declines. The number of graduate students has fallen 12.5% since 2011. Graduate enrollment at KU peaked in 1991 and has declined 25% since then. (See the chart labeled University of Kansas Enrollment, 1965-2020.)
  • Another increase in part-time enrollment. I noted last year that the number of part-time students had been rising steadily. That number rose 6.8% again this year and is 18.9% higher than it was in 2011. Part-time students now account for 17.7% of the student body. That isn’t necessarily bad, given the university’s agreement to provide dual enrollment classes with the Lawrence Public School District. It is concerning, though, given that more students nationally are choosing to pursue their degrees part time. That gives them more flexibility to work but delays graduation. In what I see as a related trend, the number of non-degree-seeking students, although still small at 445, has increased more than 200% since 2011.
  • Some perspective on freshman enrollment. As the university reported, the number of incoming freshmen declined 7.2% this fall. Since a peak in 2016, the number of incoming freshmen has declined by 9.5%. Even so, the total this year is 7% above that of 2011.
  • A continuing drop in transfer students. The transfer rate to KU can only be described as glum. The number of new transfers to the Lawrence and Edwards campuses was down 8.2% this year and the total fell below 1,000 students for this first time in more than a decade. The number of transfer students has fallen 32.7% since 2011, following the downward trend in community college enrollment.
  • Large growth from a few states. Since 2011, the number of students from seven states has increased by an average of 45%: Missouri (+40%), Illinois (+46%), Colorado (+47%), Nebraska (+76%), California (+33%), Oklahoma (+61%), Wisconsin (+42%). Collectively, students from those states (by headcount) make up 22% of the student body at the Lawrence and Edwards campuses. KU also attracts a considerable number of students from Texas and Minnesota, although those numbers have grown only slightly over the past 10 years.
  • Business continues to grow. Even as overall university enrollment declined, undergraduate enrollment in the School of Business rose 7.9% this year and has grown 131% since 2011. Enrollment in engineering declined 2.2% this year but is up 31.6% since 2011. Enrollment in liberal arts and sciences continues to sag. Undergraduate enrollment in the College fell 4.8% this year and is down 21% since 2011. Graduate enrollment was down only slightly less. Even so, the College of Liberal Arts and Sciences still has nearly five times as many students as either business or engineering.

Where do we go from here?

Demographically over the past decade, the KU student population has become more Hispanic, more multiethnic and more female but less Kansan and less international. It is still predominantly white (68%) and is more oriented toward business and engineering. It has grown younger over the past decade, with students 22 and younger making up about 70% of the student body, compared with about 64% in 2011.

The university has about 1,500 fewer students than it did a decade ago. It has a slightly larger percentage of undergraduate students than at the start of the decade, although the proportion of undergraduates to graduate students has remained within a small range since 2000. Even so, graduate enrollment has fallen more than 14% since 2011.

I’ve written frequently about the challenges higher education faces, about the need to understand our students better, to innovate, to emphasize the human element of teaching and learning, to think about what we are preparing our students to do, and to provide a clearer sense of what higher education provides. This year’s enrollment figures simply reinforce all of that.

This is the fourth consecutive year of enrollment decline at KU and the ninth consecutive decline at the six regents universities. Those declines have become increasingly painful because of growing reliance on tuition and fees to pay the bills. In Fiscal 2019, tuition and fees accounted for more than 30% of the Lawrence campus’s $900 million in revenue. State appropriations accounted for just over 15%. In other words, students pay about $2 for every $1 the state provides. That is unlikely to improve in the foreseeable future, especially with the state facing a projected $1.5 billion shortfall in the current fiscal year.

In other words, the future of the university depends greatly on enrollment. Enrollment depends greatly on the value that students and parents see in KU. It’s up to all of us to make sure they do indeed understand that value.


Doug Ward is the associate director of the Center for Teaching Excellence and an associate professor of journalism and mass communications. You can follow him on Twitter @kuediting.

By Doug Ward

Enrollment at Kansas regents universities declined again this year. I say again because enrollment has declined each year since 2011.

The decline – 5.7% since 2011 — is relatively small, but it illustrates the challenges of a state university system that has become increasingly dependent on student tuition dollars to finance operations. It also illustrates the challenges that regents universities will face in the next decade as the number of traditional college-age students flattens after a post-recession “baby bust.”

**************************************

**************************************

The National Center for Education Statistics projects that undergraduate enrollment nationwide will increase about 3% by 2028, but that national average blurs regional differences. Institutions in the Midwest and Northeast are especially vulnerable. Many smaller colleges have faced growing economic problems, with some merging and more than 20 closing.

KU isn’t in any immediate danger from those trends, but the regents system as a whole is. Given the current political climate, it seems likely that Kansas will face some of the same pressures that states like Wisconsin and Alaska have faced to close or merge campuses.

In Kansas, Wichita Area Technical College merged with Wichita State two years ago, a move that made sense given their proximity. It isn’t much of a stretch to imagine financial concerns forcing additional mergers – mergers that would be much more painful than the one in Wichita. Eleven of the state’s community colleges have had double-digit enrollment declines over the past five years, and three – Cowley, Allen and Highland – have seen enrollment fall by more than 20%. Even Johnson County Community College, the largest in the state, isn’t immune from this trend. Its enrollment has declined 7.8% over the past five years, although there was a slight uptick this year.

I’m not trying to predict impending doom. Rather, I see the numbers as a clear signal of the need to move quickly with innovative approaches that better meet the needs of a changing student population. Colleges and universities can no longer expect student applications to simply flow in with regularity. They must find niches that set them apart, form partnerships across disciplines and institutions, do more to reach out with online courses, and develop new approaches that make a college education more of an ongoing process – and one of individual renewal – than a degree-and-done-forever approach.

The numbers at KU

KU’s full-time equivalency enrollment fell slightly this year. As you can see from the chart above, though, there has been only slight movement over the past six years. That’s mostly good news, especially because retention rates have increased. This fall, 86.2% of last year’s freshman class returned, and retention of freshmen has increased substantially since hitting a low of 77.8% in 2008.

That’s a phenomenal accomplishment made possible by the work of everyone from instructors who have adopted more effective teaching practices to advisors who have helped students make better choices to administrators who have created new support programs and allocated money and resources to address a collective problem.

The university did a good job of highlighting other aspects of this fall’s enrollment report, so I won’t go into those. I would like to touch on some other trends I saw in the enrollment figures. These figures come from various reports and public dashboards on the site of Analytics and Institutional Research. Wherever possible, I have used full-time equivalency figures rather than headcount. The regents and the federal government have shifted to full-time equivalency because it cuts down on possible distortions from part-time enrollment and allows for a better comparison across universities. The university tends to prefer headcount.

Troublesome long-term trends

Combined enrollment at the Lawrence and Edwards campuses has been mostly stable over the past few years. The longer-term trends aren’t as positive. Enrollment has declined 10.5% since 2007 and 13% since a peak in 2008.

For KU as a whole, those declines have been partly offset by a growth of 11.2% at the medical center since 2014. Enrollment at the Edwards Campus has grown in each of the past four years but is 11% below where it was in 2011.

Not surprisingly, the largest decline in the student population has been in the College of Liberal Arts and Sciences. It still has the largest number of students by far of any college at KU, but undergraduate enrollment has fallen 21.6% since 2010, and graduate enrollment has fallen 18.2%. The largest percentage gains in undergraduate enrollment since Fall 2010 have been in business (up 122%) and engineering (up 46.3%).

Interestingly, the largest percentage increase overall was in non-degree-seeking students, whose numbers have risen 181% since 2010. There were 491 of those students this fall. That’s a small number in the overall enrollment picture, but it clearly shows an interest among a group that is rarely discussed when we talk about enrollment.

Shifting gender balancechart showing decreasing percentage of male students

Men accounted for 46% of KU students this fall, the lowest percentage of the decade. The number of men enrolling at KU has declined from 49.2% in 2010, reflecting a national trend of fewer men going to college.

The number of students not reporting gender spiked this year to 524 from 75 in Fall 2018, 53 in Fall 2017 and 25 in Fall 2016. This reflects a national trend of students more willing to identify as gender fluid, transgender or non-binary.

Interestingly, the vast majority of those who did not report gender were graduate students. The breakdown of graduate students this fall is 50.6% women, 40.4% men and 9% not listing gender.

Other changes in student demographics

Several other changes in the characteristics of students are worth noting:

  • Declining number of transfer students.Transfer students have never made up a large percentage of the student population at KU, but their numbers have fallen significantly during the past decade. In Fall 2010, the Lawrence campus reported 1,404 transfer students, compared with 1,024 this fall. That is a decline of 27%.
  • Declining number of graduate students. The Lawrence campus has 5,570 graduate students this fall, a decline of 9.5% since 2016 and 13.5% since 2010. This is largely a result of a smaller number of students pursuing a master’s degree (down 19.8% since 2010), although the number of doctoral students has declined 9.1% from a peak in 2013.
  • Declining number of international students. The number of international students fell for the fourth straight year and is now 14% below a peak of 2,363 in Fall 2015. This again follows a national trend.
  • Rising number of Hispanic students. The number of Hispanic students attending KU has increased 65% since 2010, with growth in every year this decade. Hispanic students now make up 8% of the student body. This again reflects national trends.
  • Rising number of part-time students. The number of part-time students on the Lawrence and Edwards campuses surpassed 4,000 for the first time this fall. Part-time students now account for 16.3% of the total student population, the highest percentage this decade and up from 13.7% in 2012.

Changes at Edwards CampusChart showing growing number of undergraduates at edwards campus

KU’s Edwards Campus has traditionally been reliant on professional master’s programs for its enrollment. That has begun to shift toward more of a balance of graduate and undergraduate programs.

Undergraduates now account for nearly 41% of students at the Edwards campus, nearly double the percentage of a decade ago. That is an enormous shift in mission and mentality. The campus is still heavily reliant on working professionals who attend evening classes, but it has increased its online offerings, partnered with Kansas City-area schools and businesses, and drawn undergraduates to programs like information technology, molecular biosciences and exercise science.


Doug Ward is the associate director of the Center for Teaching Excellence and an associate professor of journalism. You can follow him on Twitter @kuediting.

By Doug Ward

Enrollment reports released last week hint at the challenges that colleges and universities will face in the coming decade.

Across the Kansas regents universities, enrollment fell by the equivalent of 540 full-time students, or 0.72 percent. Emporia State, Fort Hays State, Wichita State and the KU Medical Center all showed slight increases, but full-time equivalent enrollment fell at Pittsburg State (3.98 percent), Kansas State (3.09 percent), and the KU Lawrence and Edwards campuses (0.49 percent). Enrollment at community colleges fell 2.6 percent.

Those numbers reflect the regents’ shift to a metric that focuses on credit hours rather than a count of the number of students. Total undergraduate credit hours are divided by 15 and graduate credit hours by 12 to get the full-time equivalency metric. More than 60 percent of students at regents institutions enroll only part time, the regents said in a news release, and the full-time equivalency counts adjust for that. At KU’s Lawrence and Edwards campuses, 16.2 percent of students are part time. That up about 2.5 points since 2013 but still considerably lower than it was in the 1990s.

KU reported that the total number of students across its campuses grew by 63, to 28,510, although the regents’ full-time equivalency total was 24,246. KU’s growth in head count came from the medical center. On the Lawrence and Edwards campuses, the number of students declined by 76. And though the freshman class grew, diversity declined in all categories.

Without doubt, KU had several strong components in its report. The most impressive was that nearly 84 percent of 2017’s freshman class returned to the university this year. That’s an increase of 4 to 6 points from just a few years ago and the highest KU has ever recorded. That growth reflects many factors, including higher admission standards and efforts to improve teaching, advising and student outreach.

Retaining students will grow increasingly important in the coming years as U.S. birthrates decline. An analysis by Nathan Grawe of Carleton University suggests that attendance at regional four-year colleges and universities will drop by more than 15 percent by 2029. Fewer births means fewer potential students, something that could prove particularly troubling for universities in the Midwest and Northeast, where declines are expected to be the steepest.

Universities like KU rely increasingly on undergraduate tuition dollars to pay the bills, especially as states reduce funding for higher education, so a large decline in in the number of students would have significant budget consequences. Many universities have ratcheted up out-of-state recruiting and increased financial aid in hopes of attracting more students. Some have been forced to reduce out-of-state tuition rates to attract more students.

This all grows increasingly important as KU considers a budget model that would allocate departmental resources in part on the number of undergraduate credit hours. More students would mean more money. Fewer students would mean fewer departmental resources, putting ever more pressure on small departments that provide important perspectives on an ever-changing world but that are never likely to attract large numbers of students.

Long-term predictions are notoriously inaccurate, so there’s no guarantee that any single university will face an extreme drop in the number of students. You don’t have to look far, though, to see what might happen. Enrollment at Kansas State dropped by nearly 1,000 students last year, and its enrollment declined each year between 2015 and 2017.  That forced a budget cut of $15 million.

To make up for declining numbers of undergraduates, many universities have developed new master’s programs, many of them online, to tap into a demand for new skills and new credentials. Between 2000 and 2015, the number of master’s degrees granted at U.S. institutions rose by more than 60 percent. They have also added online classes for undergraduates to allow more flexibility for students who often work more than 20 hours a week to pay their bills.

The vast majority of tuition dollars still come from undergraduates, and without a doubt, attracting even the same number of students will grow increasingly challenging in the coming decade. Universities can’t just play numbers games, though. Volumes of students and credit hours may pay the bills, but unless universities elevate the importance of high-quality teaching and learning, those numbers mean little. In an increasingly competitive environment, the quality of teaching matters immensely.

Neil deGrasse Tyson on professors’ communication problem

Neil deGrasse Tyson, who has made a career out of explaining science to the public, offered  some strong criticism of higher education in a recent interview with The Chronicle of Higher Education. He said that a misguided rewards systems discouraged professors from reaching out beyond a small group of like-minded colleagues.

“If communicating with the public were valued in the tenure process, they’d be better at it. This is an easy problem to solve. If 20 percent of the evaluation for tenure were based on how well you communicate with the public, that’s a game changer. All of a sudden universities open up, and people learn about what you’re doing there, whether it’s bird wings or paramecia.

“But in the end, universities don’t really care. Put that in big letters.”


Doug Ward is the associate director of the Center for Teaching Excellence and an associate professor of journalism. You can follow him on Twitter @kuediting.

By Doug Ward

Here’s one more reason to worry about rising tuition rates: decreased diversity.

In an examination of 14 years of tuition increases at public colleges and universities, Drew Allen of Princeton University and Gregory Wolniak of New York University found that for every $1,000 that tuition goes up, racial and ethnic diversity among students goes down by 4.5 percent.

To put that into perspective, they point to a College Board report showing that between 2008 and 2018, average tuition and fees at public four-year colleges and universities increased $2,690, or 37 percent. In some cases, tuition rose by $1,000 in only a year or two, they write in The Conversation.

Photo by Naassom Azevedo, Unsplash

Allen and Wolniak’s study examined 600 four-year and 1,000 two-year public institutions between 1998 and 2012. The correlation between increases in tuition and declines in diversity was most pronounced at colleges and universities they described as the “least-selective.”

Relatedly, they found that a 1 percent increase in tuition at four-year private colleges or universities led to a 3 percent increase in diversity at nearby public institutions. In other words, tuition increases make a difference at both public and private universities.

“The end result is the nation’s colleges and universities become less reflective of the ethnic diversity of the United States as a whole,” Allen and Wolniak write.

The highest rejection rates, state by state

In the status-obsessed universe of higher education, colleges and universities often measure their standing by the percentage of students they reject.

It’s a circular process. Institutions deemed to be the best receive the highest numbers of applications. Those with the highest number of applications reject larger numbers of students, solidifying their desirability by maintaining low acceptance rates.

I won’t get into the validity of that game here, but I did think a recent a recent state-by-state list of colleges and universities with the lowest acceptance rates was interesting. You can guess many of them: Harvard (5.4 percent acceptance rate), Yale (6.3 percent), Princeton (6.5 percent), University of Chicago (7.9 percent).

You’ll probably have a harder time determining which universities in states other than Massachusetts, Connecticut, New Jersey, and Illinois have the lowest acceptance rates. At least I did. The website 24/7 Wall Street listed those universities in an article called “The Hardest Colleges to Get Into in Every State.” Not surprisingly, most are private universities, although a fair number are public.

In Kansas, Sterling College has the lowest acceptance rate (37.4 percent). That compares with more than 90 percent at KU, K-State and Wichita State. Other regents universities have slightly lower admission rates.

For comparison, here are the universities in surrounding states with the lowest admission rates:

  • Colorado: Air Force Academy (15.1 percent)
  • Iowa: Grinnell College (20.2 percent)
  • Missouri: Washington University (16.5 percent)
  • Nebraska: Creighton University (70.7 percent)
  • Oklahoma: University of Tulsa (37 percent)

These are the state universities that made the list:

  • University of Alaska (73.5 percent)
  • University of Arkansas (41.9 percent)
  • Clemson (50.5 percent)
  • Delaware State University (40.6 percent)
  • Georgia Tech (25.8 percent)
  • University of Idaho (75.9 percent)
  • University of Michigan-Ann Arbor (28.6 percent)
  • University of Washington-Seattle (45.3 percent)
  • University of Wisconsin-Madison (52.6 percent)
  • University of Wyoming (95.1 percent)

Interestingly, the increasing difficulty of getting into some public universities was recently identified as one of the top education trends to watch during the coming academic year. Scott Jaschik, editor of Inside Higher Ed, listed the growth of “public Ivies” among a trends list he offered to members of the Education Writers Association. In addition, he said, some universities have increased the number of students they put on waitlists, raising students’ hopes even as the likelihood of eventual admission declines.

Briefly …

A new study in the interdisciplinary journal PLOS One offers additional evidence for providing pedagogical training to graduate students. The study found that Ph.D. students who were trained in evidence-based teaching practices were just as good at research as those who focused on research alone. … MindShift offers four useful principles for approaching student-centered learning. The article is aimed at K-12 instructors, but it applies to college instructors, as well. … More colleges and universities now use Canvas than use Blackboard, e-Literate reports. In terms of market share, the two are tied at 28 percent, but Canvas has two more institutional users than Blackboard.


Doug Ward is the associate director of the Center for Teaching Excellence and an associate professor of journalism. You can follow him on Twitter @kuediting.

By Doug Ward

This fall’s enrollment figures contained much for the University of Kansas to be proud of, and the university rightly bragged about that.

Freshman enrollment has grown for five years in a row, and the incoming class is made up of nearly 23 percent minority students.

That was great news, especially because more restrictive admissions standards went into place this fall. Those higher admissions standards show up in the 3.58 average GPA of the incoming class.

Two other enrollment trends are worth watching, though. If they continue, they could reshape the makeup of the student body in very different ways.

As the accompanying chart shows, women have outnumbered men in all but two of the last 15 freshman classes. The gap between women and men has grown since 2011, though, and the percentage of men in this year’s KU freshman class was the lowest since 2002.

KU’s numbers reflect a national – and even international – trend. In fall, 2014, for instance, the number of women enrolled in U.S. colleges exceeded that of men by more than two million, with women accounting for 56 percent of all college students that year, according to the National Center for Education Statistics. Relatedly, the percentage of women receiving bachelor’s degrees has exceeded that of men in every year since the 1990s, NCES reports. Those differences show up in graduate education, as well, and are expected to grow slightly through 2025, NCES projects.

The differences can be traced to many factors that extend back decades, the National Bureau of Economic Research says, including more women putting off marriage and pursuing careers. It starts much earlier, though, with girls’ cognitive skills developing more quickly than those of boys, and giving them a lasting advantage through high school and into the college admissions process.


The other enrollment trend worth noting is a rising number of out-of-state students. Over the past six years, the number of KU freshmen coming from outside Kansas has grown 57.5 percent.

This, too, reflects a national trend. As I wrote in the spring, state colleges and universities have actively sought to bring in more students from out of state and from other countries. These students pay higher tuition rates, and colleges have used that money to make up for budget cuts from state legislatures.

As the New York Times reported last month, declining state aid has led to sharply higher tuition in some states, making out-of-state colleges more competitive and in some cases cheaper.

Also worth noting:

  • The number of students transferring to KU rose for the first time in five years, to 1,136. That total is still nearly 19 percent lower than it was in 2012.
  • More men than women transfer to KU, with men making up 54.2 percent of transfer students.
  • Graduate students accounted for nearly all the growth in enrollment at KU this fall. The number of undergraduates increased by 19 this fall while the number of graduate students increased by 310.

Doug Ward is the associate director of the Center for Teaching Excellence and an associate professor of journalism. You can follow him on Twitter @kuediting.

By Doug Ward

Course redesign has become a crucial piece of helping college students succeed.

The statistics below about enrollment and graduation rates make it clear that success is too often elusive. Course redesign is hardly the only solution to that problem, but it is a proven, tangible step that colleges and universities can take.

Course redesign involves moving away from faculty-centered lectures and adopting student-centered techniques that improve learning. It usually includes online work that students do outside of class and in-class work that allows them to delve deeper into course material. (For more, see the report of the Provost’s Task Force on Course Redesign, of which I was a member.)

In the most recent issue of Change magazine, Carol Twigg of the National Center for Academic Transformation lists seven strategies that she says are “essential to improving the quality of student learning.” These strategies have emerged from the center’s work over the past 15 years and mesh well with what we have found at CTE. They are:

Brad Osborne with a group of students in a music theory class
Brad Osborne works with students in a music theory course he redesigned to provide more interaction and active learning.
  • Redesigning courses across sections to provide consistency.
  • Focusing on active learning.
  • Increasing student interactions. This includes group work and other activities that take the place of lecture.
  • Building in prompt, automatic feedback. This involves use of digital tools to provide feedback on quizzes and other assignments.
  • Providing one-on-one assistance. Twigg writes, “Students cannot live by software alone: They need human contact as well as encouragement to assure them that they are on the right learning path.”
  • Requiring sufficient time on task. This means providing incentives for attendance, participation, and completion of assignments.
  • Monitoring student progress and intervening when necessary.

As Twigg explains, none of this can be done without strong departmental and university support. She provides several excellent suggestions on how schools can do this.

College enrollment and completion rates decline

Two reports from the National Student Clearinghouse point to struggles among colleges to attract and keep students.

In one report, the clearinghouse said that six-year graduation rates for students who entered college in 2009 fell to 52.9 percent. That is down from 55 percent among students who began in 2008. Declines were steepest among students who delayed entering college after high school, and among adults.

Students at public universities fared better than the overall average, with 61.2 percent graduating in six years. That is still a decline from 62.9 percent among those who began in 2008. Six-year graduation rates at private universities were 10 points higher, at 71.5 percent.

The clearinghouse attributed the declines in part to strains brought on by the Great Recession, saying that they could have been even greater had colleges and universities not created programs to improve student success.

In another report, the clearinghouse said that fall enrollment at post-secondary institutions has fallen for the third straight year. Four-year public universities bucked that trend, with enrollment rising by 0.4 percent. Enrollment at all other types of post-secondary institutions declined: four-year for-profit colleges by 13.7 percent, two-year public colleges by 2.4 percent, and four-year non-profit private universities by 0.3 percent.

The need for a college education

Those graduation rates loom large as the skills needed for jobs grow. By 2020, 65 percent of jobs will require education and training beyond high school, according to a report by the Center on Education and the Workforce.

The U.S. has a long way to go. About a third of Americans age 25 and older hold a bachelor’s degree, and nearly 40 percent hold at least a two-year degree. (That varies widely by race and ethnicity, though.) Income generally rises along with level of education, but as Brian Stoffel of the Motley Fool explains, that doesn’t mean there’s a direct correlation or that a higher income translates into greater job satisfaction. Not everyone needs or wants a four-year degree. Anyone who wants to adapt to a changing job landscape, though, must be willing to continually gain new skills.

High school graduation rates rise

Interestingly, as colleges and universities struggle to maintain enrollments, the high school graduation rate has reached a record high. As The Atlantic reports, 82 percent of high school seniors received diplomas in 2014.

It points out many reasons to be skeptical of those numbers, though. And The New York Times goes even further, suggesting that high graduation rates may really be a sign of diminishing expectations and lower standards at some schools.

College rankings that follow the money

I don’t give college rankings systems much credence. Far too much of academic success depends on students’ backgrounds and on the amount of effort they put into their academic work, regardless of what college they attend.

The latest fad in rankings focuses on graduates’ earnings, something that has emerged as college costs have risen.

By one measure of earnings, The Topeka Capital-Journal reports, most of Kansas’s public universities don’t hold up well. Graduates of all but one state public university (Pittsburg State) earn less than expected 10 years after they began college. The article is based on federal data compiled by the Center for Education and the Workforce at Georgetown University, which created a salary-weighted rankings system.

Under this measure, KU ranks 1,212 out of 1,400 institutions. At the top are the University of Colorado at Denver, and (yes) Georgetown.

Much of the Capital-Journal article is taken up by university officials speculating about why their graduates fare so poorly under these rankings. The upshot: No one really knows, as is the case with most rankings.

Briefly …

Maine is the only state in New England that spends more on education than on prisons, The Bangor Daily News reports, citing a study from the American Academy of Arts & Sciences. …

Douglas Anderson of Southern Illinois University vents about university administrative bloat and suggests that higher education could solve many academic problems by slashing administrative staff and hiring “an army of good teachers.” …

Expect more top administrators in higher education to come from business and industry rather than the academy, the Hechinger Report says. The reasons: financial struggles, public pressure, and a lack of high-quality candidates from within academia.


Doug Ward is the associate director of the Center for Teaching Excellence and an associate professor of journalism. You can follow him on Twitter @kuediting.

CTE’s Twitter feed