By Doug Ward
The headlines about KU’s fall enrollment sounded much like a Minnesotan’s assessment of winter: It could be worse.
Indeed it could have been, given the uncertainties brought on by the coronavirus and rumblings among students that they might sit out the year if their courses were online.
Depending on how you measure, enrollment on the Lawrence and Edwards campuses fell either 2.7% (headcount) or 3.4% (full-time equivalency) this fall. That is about the same as the nationwide average (-3%) but slightly worse than the average decline of 1.4% at four-year public universities, according to data from the National Student Clearinghouse Research Center.
A single year’s top-level data provides only a limited view of a much bigger picture. To better understand this year’s enrollment, we need to take a broader and deeper look in terms of geography, history and demographics. Here’s what I’m seeing in data from Academics and Analytical Research, the Kansas Board of Regents and some other sources.
Enrollment declines throughout the state
KU was hardly alone in dealing with the sting of an enrollment decline. Among regents universities, Pittsburg State had the largest decline in enrollment (-5.9%), followed by K-State (-5.1%), KU, Wichita State (-3.1%), Fort Hays State (-2.8%) and Emporia State (-2.3%).
As a whole, the state’s community colleges fared far worse, with a combined drop of 11.7%, about 2 percentage points higher than the national average. Johnson County Community College had the largest decline (18.7%). Enrollment at JCCC has fallen 23.5% over the past five years, a troubling statistic given KU’s proximity and institutional connections to JCCC. During that same period, enrollment at the state’s 19 community colleges has fallen by an average of 18.6%, according to regents statistics. Eight of those colleges recorded declines of more than 20%.
Kansas is one of 11 states where the decline in undergraduate enrollment exceeded the national average, according to the National Student Clearinghouse Research Center, Others include Missouri, Arkansas, Illinois, Indiana and Florida. Only five states recorded increases in undergraduate enrollment, including Nebraska.
Putting the trends into perspective
Over the past 50 years, college and university enrollment has reflected broader societal trends that made a college degree a sought-after goal. As numbers trend downward, though, enrollment figures also highlight the looming challenges that most of higher education faces.
From the 1960s to the 1980s, undergraduate enrollment rose steadily as baby boomers entered college in larger percentages than previous generations. The number of colleges – especially community colleges – grew, providing more opportunities for students to seek a degree. Federal aid, including low-interest loans, also expanded, as the federal government promoted the importance of education and invested in university research. A college degree became the minimum standard for many jobs and led to higher salaries over a degree holder’s lifetime.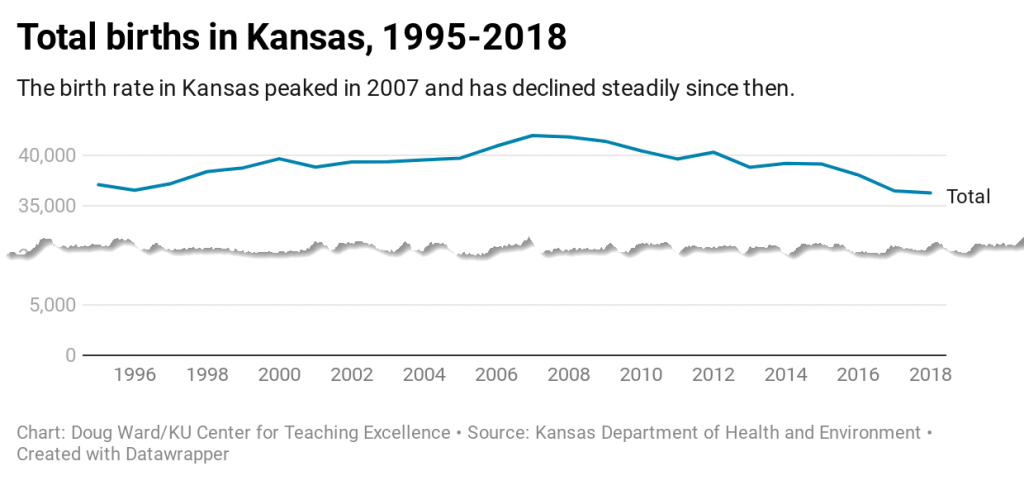
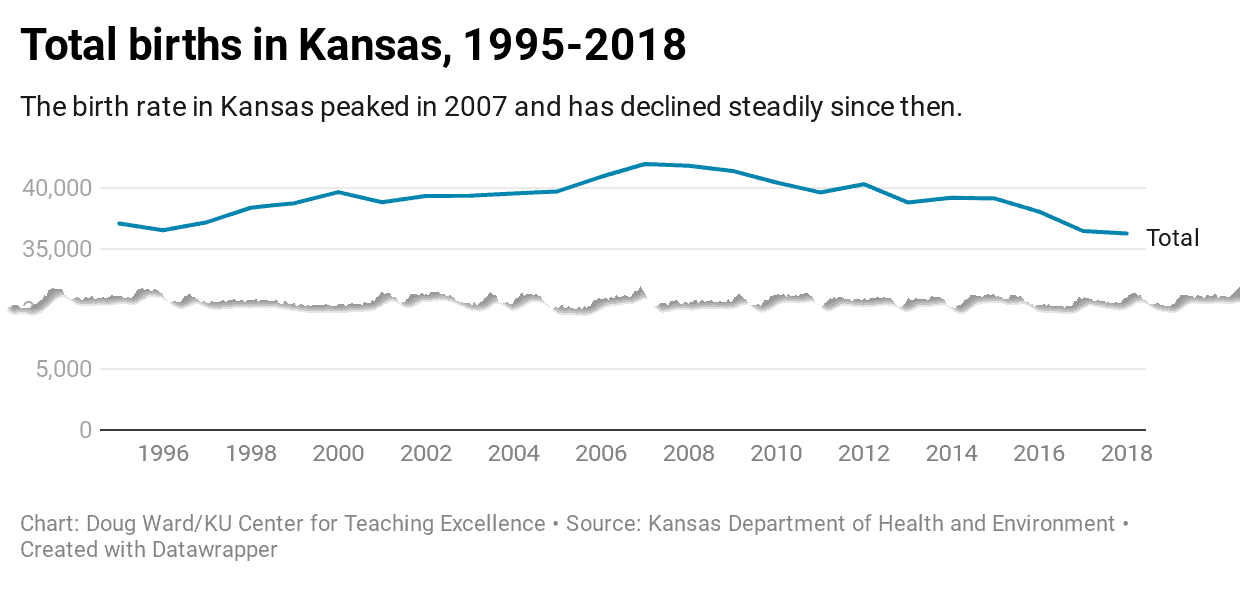
Those trends are certainly reflected in KU’s enrollment data. Between 1965 and 1991, headcount enrollment at KU nearly doubled. (See the chart below.) It declined after a recession in the early 1990s, but rose again in the early 2000s, peaking in 2008 during the recession. It declined until 2012, stabilized briefly, and then began another decline, one that is very likely to continue given a declining school population. K-12 enrollment in Kansas peaked in the 2014-15 school year, according to Kansas State Board of Education data. It is projected to start a significant decline in the late 2020s, largely because of a decline in birth rates after the recession of 2007-08. Since peaking in 2007, birth rates in Kansas have fallen 13.6%. (See the chart above with the most recent data available from the state.)
In another disturbing trend, the number of Kansas students coming to KU has dropped 17.7% since 2011. (It was down 2.9% this year.) The university has attracted more out-of-state students, who make up about 40% of the student population, but the trends among Kansas students are bleak.
KU attracts the largest number of students from Johnson County, which accounts for 28.3% of the university’s enrollment. The number of students from Johnson County has fallen 7.3% over the past decade. That is far less than the drop in students from other counties from which the university draws the most students: Douglas (-25.2% since 2011), Sedgwick (-27.1%), Shawnee (-26%). Declines in others aren’t as dramatic but are still troubling: Wyandotte (-9.8%), Leavenworth (-3.3%) and Miami (-3.2%). Others are far worse: Saline (-30.5%), Riley (45.1%), Reno (42.3%).
More Hispanic students, fewer international students
One of the most interesting developments I saw in enrollment this fall was that for the first time in decades, the number of Hispanic students at KU exceeded the number of international students. (See the chart below.)
This reflects two major trends. First the Hispanic population of Kansas has grown more than 70% since 2000. Hispanics now make up more than 12% of the Kansas population and 18.5% of the U.S. population. The number of Hispanic students at KU rose 3.3% this year and has risen nearly every year since the mid-1980s.
Meanwhile, the Trump administration has taken a less-than-welcoming stance toward international students and immigration in general. That, combined with a global pandemic and lack of a coherent plan for combatting the pandemic, has sent international enrollment at U.S. universities plummeting. By one estimate, the number of new international students at U.S. universities could soon reach the lowest level since World War II.
As KU reported, the number of international students at the university declined more than 18% this fall. That decline is greater than the 12.5% decline in international students at public four-year universities, according to data from the National Student Clearinghouse.
Other trends worth noting
- A continuing rise in female students. The number of female students on the Lawrence campus continued to exceed the number of male students. The number of male students fell 1.4% this year, compared with 0.5% for female students, and has fallen 11% since 2011. For the first time in at least a decade, the number of women who transferred to KU was larger than the number of men who transferred. Men now make up 47.5% of the KU student population. Nationally, the number of women seeking college degrees surpassed the number of men seeking degrees in 1979. That was the first time since World War II that more women than men attended college, according to the National Center for Education Statistics. In the 40 years since then, the gap has only increased, as it did again this year. Sixty-seven KU students did not identify as male or female this year. That was similar to the 73 in 2018 but down from 509 in 2019, suggesting that last year’s spike was intended as statement against the reporting system, primarily by graduate students.
- Another decline in graduate enrollment. The number of graduate students on the Lawrence campus fell 2.2% this year, compared with an increase of 4.7% at public four-year universities. That is the fourth consecutive year of declines. The number of graduate students has fallen 12.5% since 2011. Graduate enrollment at KU peaked in 1991 and has declined 25% since then. (See the chart labeled University of Kansas Enrollment, 1965-2020.)
- Another increase in part-time enrollment. I noted last year that the number of part-time students had been rising steadily. That number rose 6.8% again this year and is 18.9% higher than it was in 2011. Part-time students now account for 17.7% of the student body. That isn’t necessarily bad, given the university’s agreement to provide dual enrollment classes with the Lawrence Public School District. It is concerning, though, given that more students nationally are choosing to pursue their degrees part time. That gives them more flexibility to work but delays graduation. In what I see as a related trend, the number of non-degree-seeking students, although still small at 445, has increased more than 200% since 2011.
- Some perspective on freshman enrollment. As the university reported, the number of incoming freshmen declined 7.2% this fall. Since a peak in 2016, the number of incoming freshmen has declined by 9.5%. Even so, the total this year is 7% above that of 2011.
- A continuing drop in transfer students. The transfer rate to KU can only be described as glum. The number of new transfers to the Lawrence and Edwards campuses was down 8.2% this year and the total fell below 1,000 students for this first time in more than a decade. The number of transfer students has fallen 32.7% since 2011, following the downward trend in community college enrollment.
- Large growth from a few states. Since 2011, the number of students from seven states has increased by an average of 45%: Missouri (+40%), Illinois (+46%), Colorado (+47%), Nebraska (+76%), California (+33%), Oklahoma (+61%), Wisconsin (+42%). Collectively, students from those states (by headcount) make up 22% of the student body at the Lawrence and Edwards campuses. KU also attracts a considerable number of students from Texas and Minnesota, although those numbers have grown only slightly over the past 10 years.
- Business continues to grow. Even as overall university enrollment declined, undergraduate enrollment in the School of Business rose 7.9% this year and has grown 131% since 2011. Enrollment in engineering declined 2.2% this year but is up 31.6% since 2011. Enrollment in liberal arts and sciences continues to sag. Undergraduate enrollment in the College fell 4.8% this year and is down 21% since 2011. Graduate enrollment was down only slightly less. Even so, the College of Liberal Arts and Sciences still has nearly five times as many students as either business or engineering.
Where do we go from here?
Demographically over the past decade, the KU student population has become more Hispanic, more multiethnic and more female but less Kansan and less international. It is still predominantly white (68%) and is more oriented toward business and engineering. It has grown younger over the past decade, with students 22 and younger making up about 70% of the student body, compared with about 64% in 2011.
The university has about 1,500 fewer students than it did a decade ago. It has a slightly larger percentage of undergraduate students than at the start of the decade, although the proportion of undergraduates to graduate students has remained within a small range since 2000. Even so, graduate enrollment has fallen more than 14% since 2011.
I’ve written frequently about the challenges higher education faces, about the need to understand our students better, to innovate, to emphasize the human element of teaching and learning, to think about what we are preparing our students to do, and to provide a clearer sense of what higher education provides. This year’s enrollment figures simply reinforce all of that.
This is the fourth consecutive year of enrollment decline at KU and the ninth consecutive decline at the six regents universities. Those declines have become increasingly painful because of growing reliance on tuition and fees to pay the bills. In Fiscal 2019, tuition and fees accounted for more than 30% of the Lawrence campus’s $900 million in revenue. State appropriations accounted for just over 15%. In other words, students pay about $2 for every $1 the state provides. That is unlikely to improve in the foreseeable future, especially with the state facing a projected $1.5 billion shortfall in the current fiscal year.
In other words, the future of the university depends greatly on enrollment. Enrollment depends greatly on the value that students and parents see in KU. It’s up to all of us to make sure they do indeed understand that value.
Doug Ward is the associate director of the Center for Teaching Excellence and an associate professor of journalism and mass communications. You can follow him on Twitter @kuediting.
Recent Comments