Cleve Moler meets with students and faculty members after speaking at Eaton Hall.

By Doug Ward

“Look over Spock’s shoulder,” Cleve Moler told the audience at Eaton Hall on Thursday.

He was showing a clip from Star Trek: The Motion Picture, the 1979 movie that revived the classic 1960s science fiction television series. In a scene from the bridge of the Starship Enterprise, colorful graphics blink on a futuristic array of monitors.

Those graphics, Moler explained, came from what is now the Los Alamos National Laboratory, where he was part of team that developed a computational math library and an accompanying library for computer graphics. That work, written in Fortran, was “just a matrix calculator,” Molder said, but it was the basis for Matlab, software that creates an interactive environment for computation, visualization, modeling, and programming.

Moler, a former professor at New Mexico, Michigan and Stanford, is the “chief mathematician” and chairman of MathWorks, a company he co-founded in 1984. He visited KU this week, speaking to an auditorium filled mostly with undergraduates, but also with faculty and administrators, for the Russell Bradt Undergraduate Colloquium.

Graphics from the Los Alamos National Laboratory were used in scenes from “Star Trek: The Motion Picture.”

I’m not a mathematician, so I won’t pretend to understand the intricacies of Matlab. What I do understand is that Matlab plays an important role in researching and teaching mathematics, engineering, and other STEM areas. It is an environment created by mathematicians for mathematicians, and it has attained near iconic status in the academic world, with more than a million users.

In his talk at Eaton Hall, Moler spoke in a gravelly but upbeat voice about his influences in mathematics and computer science and about the steps that led to the development of Matlab. MathWorks, the company, started in 1984 with one employee, doubling every year for the first seven years. It now has about 4,000 employees in 20 offices around the world, Moler said. It has also expanded into such areas as cell biology, image processing, hearing aids, and driverless cars.

About midway through his talk, Moler gleefully described a project called Eigenwalker, which is using Matlab to break the human gait into its mathematical components and using those calculations to create stick and dot animations. As half a dozen panels with stick figures walked in place on the screen, Moler grinned at the audience and said: “I enjoy that demo. Everybody enjoys that demo.”

Then his analytic side came out.

“It’s all very amusing,” he said, “but what do we see here that’s so enjoyable?”

Through those stick figures, he said, we can understand things like mood, gender, and personality just by observing the way they move, and researchers are using the animations to study how people perceive others through their walk.

At 78, Moler doesn’t move nearly as smoothly as he did when he created Matlab, but his status as a math star was apparent at a reception in Snow Hall, where he sat with a cup of coffee and a cranberry oatmeal cookie talking with Professor Marge Bayer and others from the math department. Graduate students ringed the room, seemingly reluctant to approach Moler. They needn’t have worried. Despite his genius, Moler loves interacting with people, telling stories of his family and of the evolution of Matlab.

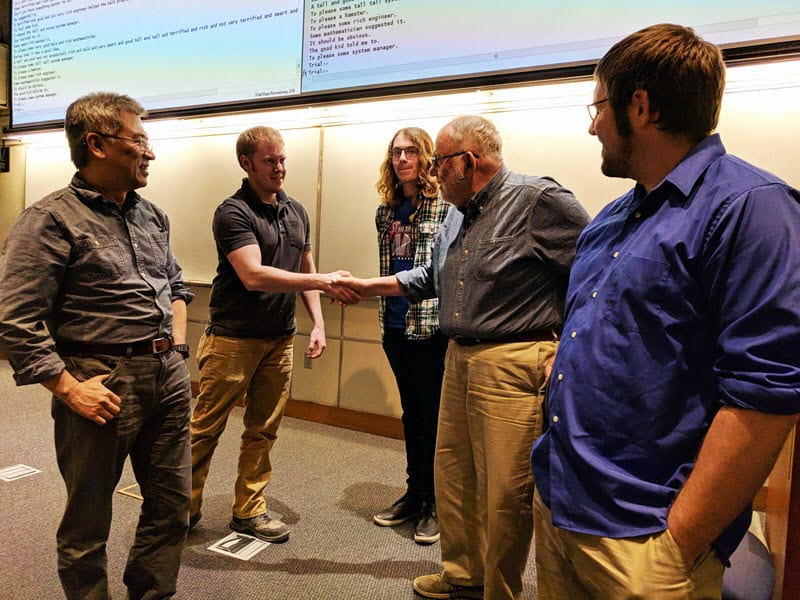
He shared one of those stories at the end of his talk at Eaton Hall after a student asked about the “why” command in Matlab. The original Matlab used terminal input, he said, and provided answers for commands like “help,” “who,” and “what.” Moler and others decided that Matlab needed a “why” function to go along with the others, so they programmed it to respond with “R.T.F.M.” when someone typed “why.”

That stood for “read the manual,” he said, with an extra word in the middle starting with “f.”

The room erupted in laughter.

Over the years, the “why” function became an inside joke, an Easter egg in Matlab that provided random humorous answers. He gave his audience a sneak peak of 30 or so new responses, including “Some smart kid wanted it,” “To please some system manager,” “To fool a young tall hamster,” “Some mathematician suggested it,” and “How should I know?”

At the end of his talk, Moler made a pitch for his company, which he said was hiring 250 to 300 “good people who know Matlab.” It wasn’t quite the same as in invitation to the bridge of the Enterprise, but for young mathematicians, it was close.

An entrepreneur endorses the liberal arts

The liberal arts got a recent thumbs-up from an unlikely source: Mark Cuban, the entrepreneur, Shark Tank star, and owner of the Dallas Mavericks.

“Unlikely” may not be quite the right description because Cuban encourages high school students to attend college and has a college degree himself (Indiana University business administration, 1981). So he is hardly part of the drop-out-now-and-chase-your-dream crowd of Silicon Valley entrepreneurs like Peter Thiel. Neither is he bullish on higher education, though. He has argued that colleges and universities are constructing unnecessary buildings financed by rising tuition, and that higher education is in the midst of a bubble, much as real estate was before 2008.

“As far as the purpose of college, I am a huge believer that you go to college to learn how to learn,” Cuban wrote on his blog in 2012. “However, if that goal is subverted because traditional universities, public and private, charge so much to make that happen, I believe that system will collapse and there will be better alternatives created.”

In a recent interview with Bloomberg News, Cuban said that students needed to think carefully about jobs, careers, and skills.

“What looked like a great job graduating from college today may not be a great job graduating from college five years or 10 years from now,” he said.

That’s because machine learning and artificial intelligence are changing the nature of work. Companies are hiring fewer employees as technology takes over more jobs, making it crucial for people to understand how to use computers and software, he said.

“Either software works for you or you work for software, and once the software takes over, you’re gone,” Cuban said.

He predicted enormous changes in the workplace in the coming years.

“The amount of change we’re going to see over the next five years, 10 years will dwarf everything that’s happened over the last 30,” Cuban said.

Because of that, Cuban said he expected English, philosophy and foreign language majors and others who are “more of a freer thinker” to have a distinct advantage.

“I personally think there’s going to be a greater demand in 10 years for liberal arts majors than there were for programming majors and maybe even engineering,” Cuban said.

It’s refreshing to hear someone from the business world extoll the virtues of liberal education, especially as higher education – and liberal education in particular – have come under intense criticism from many sides. There is certainly much to criticize, but there is also much to be hopeful about. No matter their career path, students benefit from a broad understanding of the world, an ability to research effectively, communicate clearly and analyze critically, and a desire to keep learning. (I’ll be talking more about those skills in the coming weeks.)


Doug Ward is the associate director of the Center for Teaching Excellence and an associate professor of journalism. You can follow him on Twitter @kuediting.

By Doug Ward

BLOOMINGTON, Indiana – We have largely been teaching in the dark.

By that, I mean that we know little about our students. Not really. Yes, we observe things about them and use class surveys to gather details about where they come from and why they take our classes. We get a sense of personality and interests. We may even glean a bit about their backgrounds.

That information, while helpful, lacks many crucial details that could help us shape our teaching and alert us to potential challenges as we move through the semester. It’s a clear case of not knowing what we don’t know.

Participants at a Learning Analytics Summit workshop grapple with definitions of student success and with how they might use data to better understand teaching and learning.

That became clear to me last week at the first Learning Analytics Summit at Indiana University. The summit drew more than 60 people from universities around the country to talk about how to make more effective use of academic data. I led workshops on getting started with data projects for analyzing courses, curricula, student learning and student success. As I listened and spoke with colleagues, though, I was struck by how little we know about our courses, curricula and students, and how much we stand to gain as we learn more.

Let me provide examples from the University of California-Davis and the University of New Mexico, two schools that have been piloting electronic systems that give instructors vast amounts of information about students before classes start.

Marco Molinaro, assistant vice provost for educational effectiveness at UC-Davis, showed examples of a new system that provides instructors with graphics-rich digital pages with such details as the male-female balance of a class, the number of first-generation students, the number of low-income students, the number of underrepresented minorities, the number of students for whom English is a second language, the number of students who are repeating a class, the most prevalent majors among students in a class, previous classes students have taken, other courses they are taking in the current semester, how many are using tutoring services, comparisons to previous classes the instructor has taught, and comparisons to other sections of the same class.

For privacy reasons, none of that data has names associated with it. It doesn’t need to. The goal isn’t to single out students; it’s to put information into the hands of faculty members so they can shape their classes and assignments to the needs of students.

That data can provide many insights, but Molinaro and his staff have gone further. In addition to tables and charts, they add links to materials about how to help different types of students succeed. An instructor who has a large number of first-generation students, for instance, receives links to summaries of research about first-generation students, advice on teaching strategies that help those students learn, and an annotated bibliography that allows the instructor to go deeper into the literature.

Additionally, Molinaro and his colleagues have begun creating communities of instructors with expertise in such areas as working with first-generation students, international students, and low-income students. They have also raised awareness about tutoring centers and similar resources that students might be using or might benefit from.

Molinaro’s project is funded by a $1 million grant from the Howard Hughes Medical Institute. It began last fall with about 20 faculty members piloting the system. By the coming fall, Molinaro hopes to open the system to 200 to 300 more instructors. Eventually, it will be made available to the entire faculty.

Embracing a ‘cycle of progress’

Providing the data is just the first step in a process that Molinaro calls a “cycle of progress.” It starts with awareness, which provides the raw material for better understanding. After instructors and administrators gain that understanding, they can take action. The final step is reflection, which allows all those involved an opportunity to evaluate how things work – or don’t work – and make necessary changes. Then the cycle starts over.

“This has to go on continuously at our campuses,” Molinaro said.

As Molinaro and other speakers said, though, the process has to proceed thoughtfully.

For instance, Greg Heileman, associate provost for student and academic life at the University of Kentucky, warned attendees about the tendency to chase after every new analytics tool, especially as vendors make exaggerated claims about what their tools can do. Heileman offered this satiric example:

First, a story appears in The Chronicle of Higher Education.

“Big State University Improves Graduation Rates by Training Advisors as Mimes!”

The next day, Heileman receives email from an administrator. The mime article is attached and the administrator asks what Heileman’s office is doing about training advisors to be mimes. The next day, he receives more email from other administrators asking why no one at their university had thought of this and how soon he can get a similar program up and running.

The example demonstrates the pressure that universities feel to replicate the success of peer institutions, Heileman said, especially as they are being asked to increase access and equity, improve graduation rates, and reduce costs. On top of that, most university presidents, chancellors and provosts have relatively short tenures, so they pressure their colleagues to show quick results. Vendors have latched onto that, creating what Heileman called an “analytics stampede.”

Chris Fischer, associate professor of physics and astronomy at KU, speaks during a poster session at the analytics conference in Bloomington, Indiana.

The biggest problem with that approach, Heileman said, is that local conditions shape student success. What works well at one university may not work well at another.

That’s where analytics can play an important role. As the vice provost for teaching and learning at the University of New Mexico until last fall, Heileman oversaw several projects that relied on university analytics. One, in which the university looked at curricula as data for analysis, led to development of an app that allows students to explore majors and to see the types of subjects they would study and classes they would take en route to a degree. That project also led to development of a website for analysis and mapping of department curricula.

One metric that emerged from that project is a “blocking factor,” which Heileman described as a ranking system that shows the likelihood that a course will block students’ progression to graduation. For instance, a course like calculus has a high blocking factor because students must pass it before they can proceed to engineering, physics and other majors.

Better understanding what classes slow students’ movement through a curriculum allows faculty and administrators to look more closely at individual courses and find ways of reducing barriers. At New Mexico, he said, troubles in calculus were keeping engineering students from enrolling in several other classes. The order of classes also created complexity that made graduation more difficult. By shifting some courses, students began taking calculus later in the curriculum. That made it more relevant – and thus more likely that students would pass – and helped clear a bottleneck in the curriculum.

Used thoughtfully, Heileman said, data tells a story and allows us to formulate effective strategies.

Focusing on retention and graduation

Dennis Groth, vice provost for undergraduate education at Indiana, emphasized the importance of university analytics in improving retention and graduation rates.

Data, he said, can point to “signs of worry” about students and prompt instructors, staff members and administrators to take action. For instance, Indiana has learned that failure to register for spring classes by Thanksgiving often means that students won’t be returning to the university. Knowing that allows staff members to reach out to students sooner and eliminate barriers that might keep them from graduating.

Data can also help administrators better understand student behavior and student pathways to degrees. Many students come to the university with a major in mind, Groth said, but after taking their first class in that major, they “scatter to the wind.” Many find they simply don’t like the subject matter and can’t see themselves sticking with it for life. Many others, though, find that introductory classes are poorly taught. As a result, they search elsewhere for a major.

“If departments handled their pre-majors like majors,” Groth said, “they’d have a lot more majors.”

Once students give up on what Groth called “aspirational majors,” they move on to “discovery majors,” or areas they learn about through word of mouth, through advisors, or through taking a class they like. At Indiana, the top discovery majors are public management, informatics and psychology.

“Any student could be your major,” Groth said. That doesn’t mean departments should be totally customer-oriented, he said, “but students are carried along by excitement.”

“If your first class is a weed-out class, that chases people away,” Groth said.

Indiana has also made a considerable amount of data available to students. Course evaluations are all easily accessible to students. So are grade distributions for individual classes and instructors. That data empowers students to make better decisions about the majors they choose and the courses they take, he said. Contrary to widespread belief, he said, a majority of students recommend nearly every class. Students are more enthusiastic about some courses, he said, but they generally provide responsible evaluations.

In terms of curriculum, Groth said universities needed to take a close look at whether some high-impact practices were really having a substantial impact. At Indiana, he said, the data are showing that learning communities haven’t led to substantial improvements in retention or in student learning. They aren’t having any negative effects, he said, but they aren’t showing the types of results that deserve major financial support from the university.

As more people delve into university data, even the terms used are being re-evaluated.

George Rehrey, director of Indiana’s recently created Center for Learning Analytics and Student Success, urged participants to rethink the use of the buzzword “data-driven.” That term suggests that we follow data blindly, he said. We don’t, or at least we shouldn’t. Instead, Rehrey suggested the term “data-informed,” which he said better reflected a goal of using data to solve problems and generate ideas, not send people off mindlessly.

Lauren Robel, the provost at Indiana, opened the conference with a bullish assessment of university analytics. Analytics, she said, has “changed the conversation about student learning and student success.”

“We can use this to change human lives,” Robel said. “We can literally change the world.”

I’m not ready to go that far. University analytics offer great potential. But for now, I’m simply looking for them to shed some light on teaching and learning.

Data efforts at KU

KU has several data-related projects in progress. STEM Analytics Teams, a CTE project backed by a grant from the Association of American Universities, have been drawing on university data to better understand students, programs and progression through curricula. The university’s Visual Analytics system makes a considerable amount of data available through a web portal. And the recently created Business Intelligence Center is working to develop a data warehouse, which will initially focus on financial information but will eventually expand to such areas as curriculum, student success and other aspects of academic life. In addition, Josh Potter, the documenting learning specialist at CTE, has been working with departments to analyze curricula and map student pathways to graduation.


Doug Ward is the associate director of the Center for Teaching Excellence and an associate professor of journalism. You can follow him on Twitter @kuediting.

CTE’s Twitter feed